

The Topics of Soft Landings, Hard Landings, Recessions, and Unemployment in 5- Minutes or Less..Ready...GO
The Topics of Soft Landings, Hard Landings, Recessions, and Unemployment in 5- Minutes or Less..Ready...GO
The Down and Dirty of Soft Landings and Hard Landings...

Cartoons of the Week:


Sometimes I get writer’s block. I start off these missives with one thought in mind and end up with two, three, or four different thoughts when I am finished. Today was such a day.
I was going to outline to you today about a soft landing, a recession, and what these words really mean. As I got over a thousand words into it, with a ton of rambling, and still nowhere close to being done, I stopped. I froze. And now here I am typing this.
So, instead of taking a deep dive into specific topics today, I decided this week to keep it short and sweet and to share with you a few charts I thought were super interesting.
Here we go….
Soft Vs. Hard Landings
The three charts below were produced by Michael Kantrowitz at Piper Sandler. He does excellent work and shares some of his thoughts and ideas on Twitter at @michaelkantro.
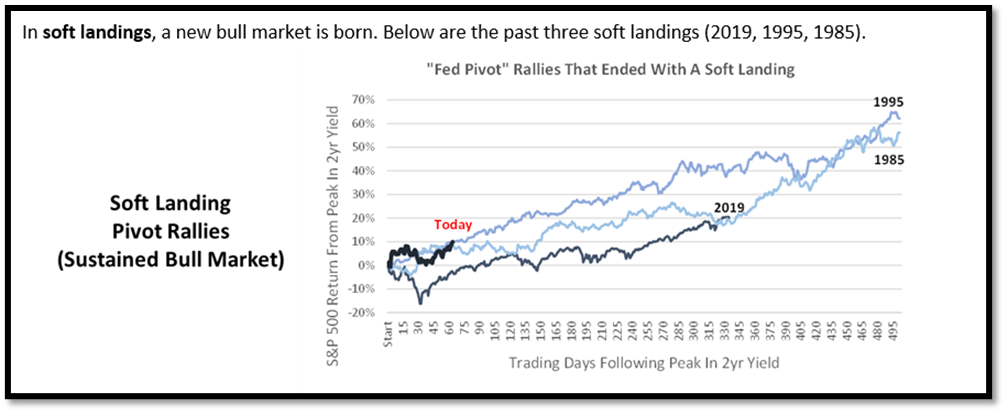
The first chart below outlines the different years that are named “soft landings” in the market. As you can see, once the 2-year yield peaked (tied to the Fed policy rate), these markets moved higher.
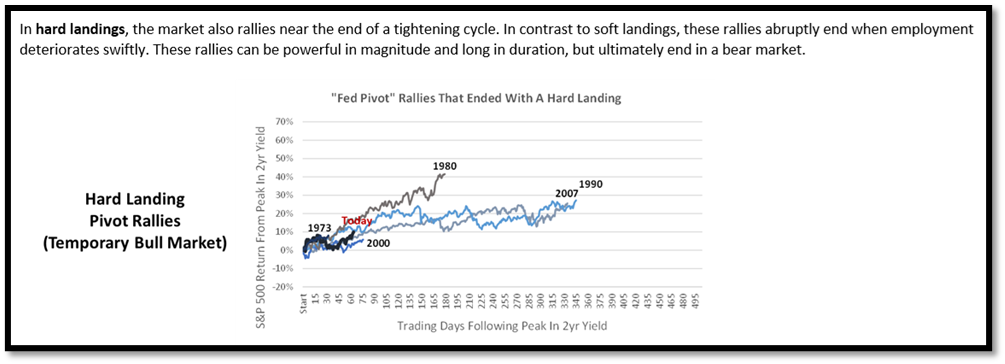
The next chart shows different years that we now classify as “hard landings”, or what we would call a recession.
What is interesting about the chart below is the fact the markets during these different time periods ALSO rallied after the 2-year yield peaked.
Some of these rallies lasted for over a year!!!
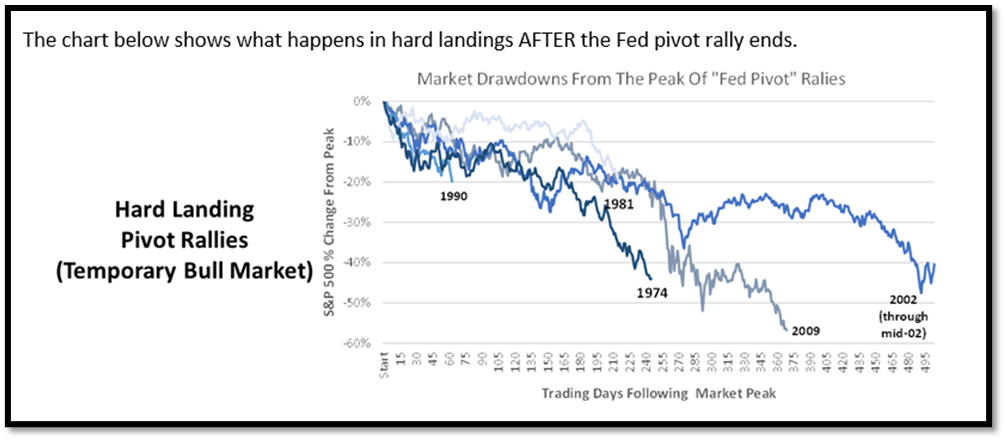
Eventually, these markets slowed and rolled over. As you can see below, recessionary time periods cause a significant drawdown for the equity market, anywhere from 25% to a loss close to 60%, but not until one or two years AFTER the peak in the 2-year yield.
Now, let’s look at the 2-year yield below.
We just set a new high TODAY!!!

So why am I showing you this?
First, both recessionary markets and soft-landing markets rally into what they see as the Fed finally stopping its rate cycle. Like what we saw at the end of 2022 and through January of this year, stock markets usually rallied on the thought we are finally close to the Fed pausing their rate and nothing has blown up yet.
In February, we receive a VERY STRONG employment number, and then this week inflation data that shows inflation starting to move slightly higher again.
Both of these data points are VERY bad for the thesis of the Fed stopping their rate hikes. As a result, most markets around the world are negative in February.
This is because most equity markets and corporate bond markets are pricing in a soft landing outcome as of today. I discussed this a few weeks back HERE.
Second, and this is the most important point, we are VERY early in this process. When we take a more detailed look at the historical data above, you can quickly see what happened over a 12-, 24-, or 36-month basis. But when you live it in real-time, it goes much slower and is much harder to judge.
Charts one and two above show what happens to the market AFTER the 2-year yield has made a top. As I just showed you in chart three, we have not even seen the top in the 2-year yield yet.
Charts one and two show data of a market rally no matter what the outcome is 100 to 400 days AFTER the peak in the 2-year yield.
So we are still very, very early folks.
Finally, when we look at these time periods outlined above, the employment data during these times had massively different outcomes.
I grabbed the employment data from the website FRED to help in our analysis.
The first chart below is the unemployment rates for the “soft landing” periods.
What do you notice?
Yes, employment stayed strong throughout the Fed Rate hikes, the peak in the 2-year yield, and the eventual outcome from those rate hikes.

Now compare the chart above with the “recession” or “hard landing” moments in the market, which you will find below.
All of these time periods saw unemployment steady for the first 6-12 months, then a big spike higher thereafter as the economy slowed.

This is proof the employment data is a lagging indicator, which is super important to understand to not use as your judge of how well the economy is doing. I talk about this topic in more detail HERE.
Conclusion
So to wrap this up, here are a few big takeaways for you to contemplate.
We are very early in this downturn and frankly, no one really knows how it will end. We need to watch inflation, unemployment, and the Fed. But the first thing we need to see is a peak in the 2-year yield. The peak in the 2-year will start the clock. As of right now, we are still warming up and have not even started the game yet.
Both soft landings and hard landings act the same at the beginning. As in any game, once it starts the score is 0-0 and both sides feel good about the outcome. If you go to Michael Kantrowitz Twitter page, you will see that he posted Financial Articles from all these periods highlighted above. And all of them started with talk of a soft landing, just like today.
The Fed’s policies will eventually impact employment. How much of an impact will be critical. If we can keep a somewhat strong employment market, which I talked about HERE, there may be a real possibility of a soft landing.
Looking at this data along with what we highlighted last week HERE, we can make a very easy argument for 2023 to be a somewhat stronger year for stocks and bonds, but with a ton of volatility. This strength is not the start of a new bull market as we saw in the late 2010s or after 2020. This cycle is VERY different which means you need to stay agile and position accordingly.
Finally, if inflation continues to stay sticky AND employment is strong, the Fed will continue to raise rates pushing the probability more toward a hard landing. In this game, the Fed members are the refs and we do not know yet if these refs are paid off or not. No matter what, like in any game, the refs will have a huge impact on who eventually wins, the soft landers or the hard landers.
Have a great weekend…..