

Leading Indicators and the Ultimate Economic Paradox
Leading Indicators and the Ultimate Economic Paradox
Financial Friday - Week 36, 2022

Cartoon of the Week:
If you want to have any chance of trying to predict what may happen next to stocks, bonds, real estate, the economy, your business, or your financial well-being, then you much understand the economy and leading indicators.
They are the best tools we have today to try and predict the future.
What are Leading Indicators?
Since World War II, we have learned that certain data points, which we call indicators, can give us hints about what may be happening in the future.
As you can see below, data points can be broken into different categories.
Leading - means they may lead the overall economy and be able to predict the future.
Coincident - those that move with the economy in real-time.
Lagging - those that turn after the economy has turned.
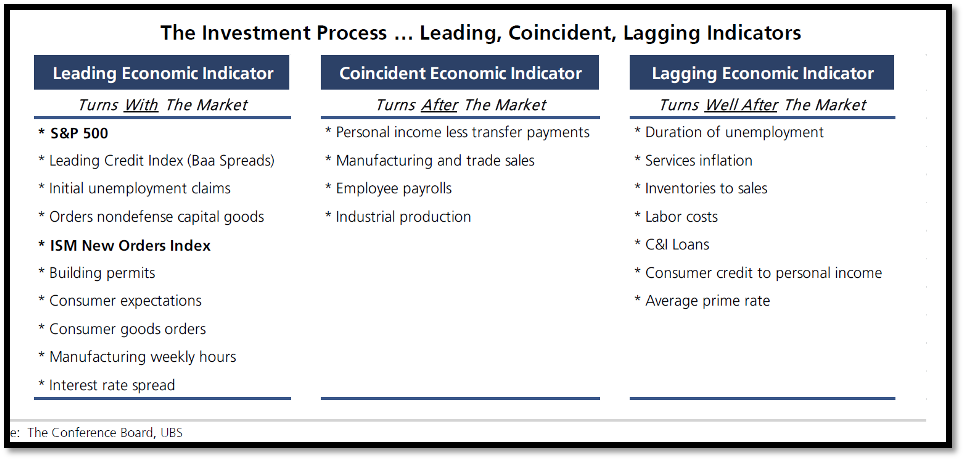
By understanding where indicators historically fall in the business cycle, we are able to know which ones we should pay attention to at certain points in that cycle.
If you want to have any chance of forecasting the economy, you must understand and use leading indicators.
Leading Indicators Showing Mixed Results
When you have indicators that are contradicting each other, then you really do not have a clear path to what may happen in the future. As a result, you have a ton of volatility with little to no real direction.
This is what we are seeing today.
Let’s look at an example.
As we talked about last week (HERE), high yield spreads can be a leading indicator and historically lead turning points in the economy and the stock market.
Today high yield spreads are neutral, showing no real stress or economic worries in that particular market.
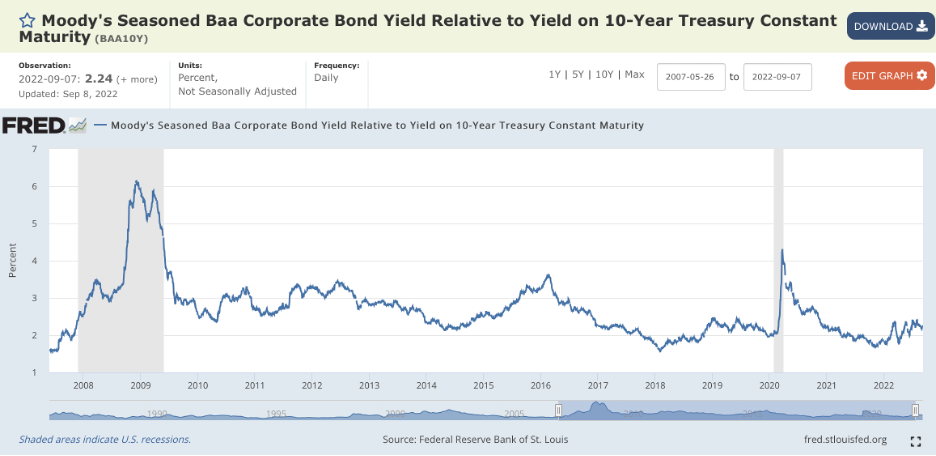
One of the leading indicators outlined in the chart above is another credit spread, the Baa credit spread.
As you can see below, they look normal at the moment (rising blue line is bad, falling is good).
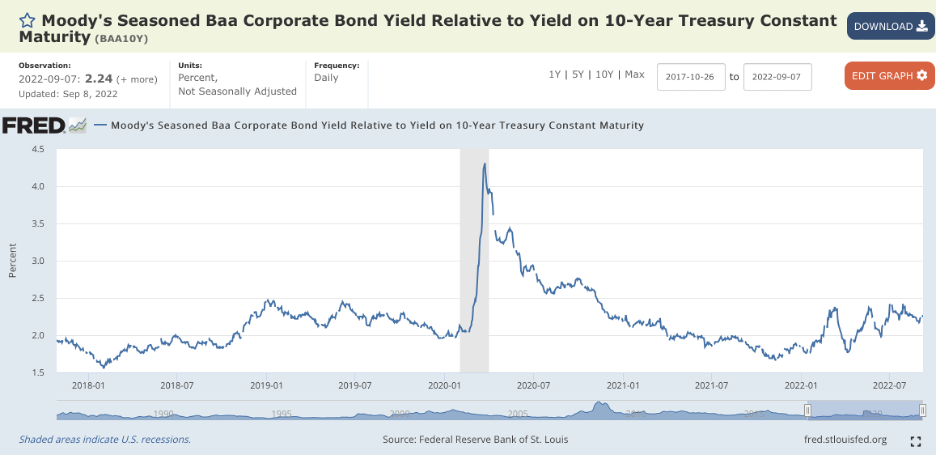
If we zoom in, you can see we have tried and failed four times to get spreads above 2.5% (again a line moving higher is usually bad for the economy, moving lower is good).
Just using high yield spreads and Baa spreads, we see no real threat today that the markets will get worse.
Let’s look at another one.
One of the closest followed leading indicators is the ISM New Orders Index.
You can see below this has been moving lower since 2021 but is still above 50.
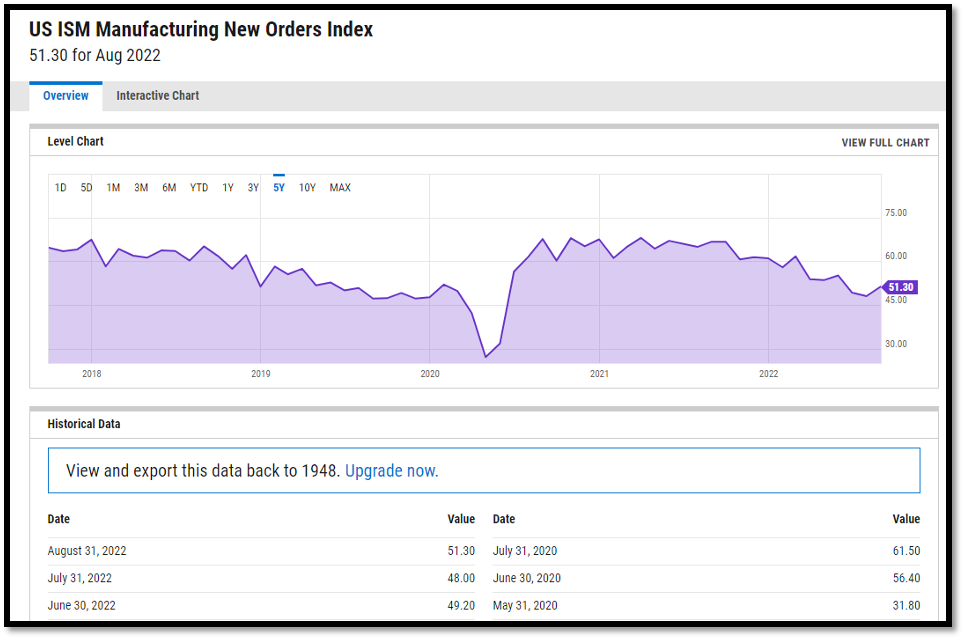
Why is 50 so important?
The 50 level on most indicators is the line in the sand between expansion and contraction.
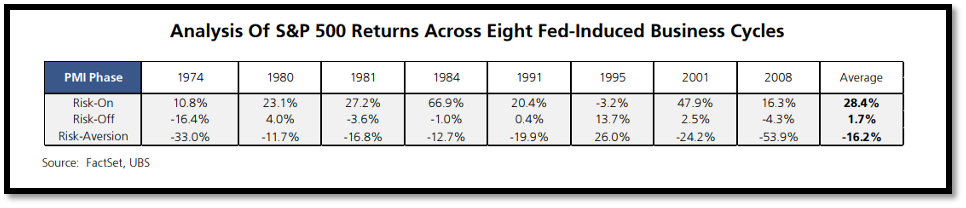
As you can see below, when this line is above 50 and rising (titled risk on), it’s time to be fulling invested in the market.
When it is falling but still above 50, like it has since the middle of 2021, we usually see an increase in volatility and sideways action in the market.
But when it is falling, and below 50 (titled risk aversion), that is when we really see the pain in the markets.

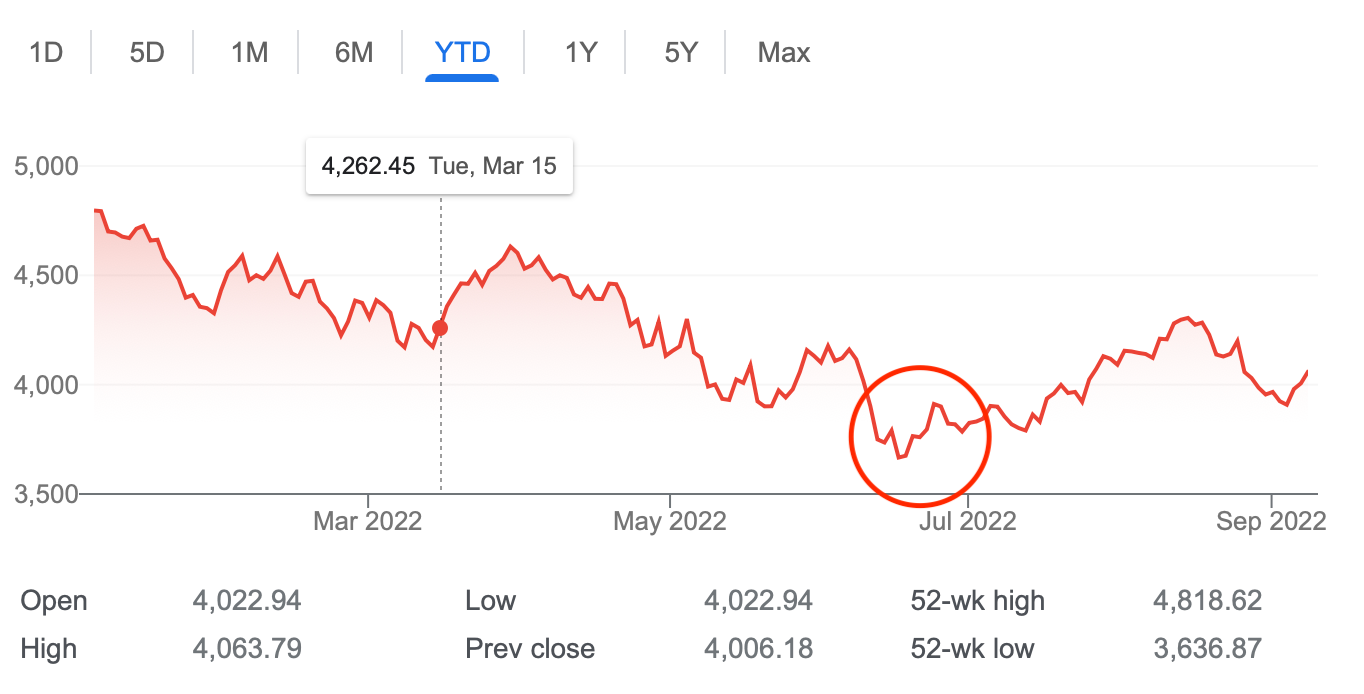
If we look closely at the new order index below, you can see in June we saw a big decline month over month and a move below 50.
This corresponded with June stock performance, which was the second worst month this year.
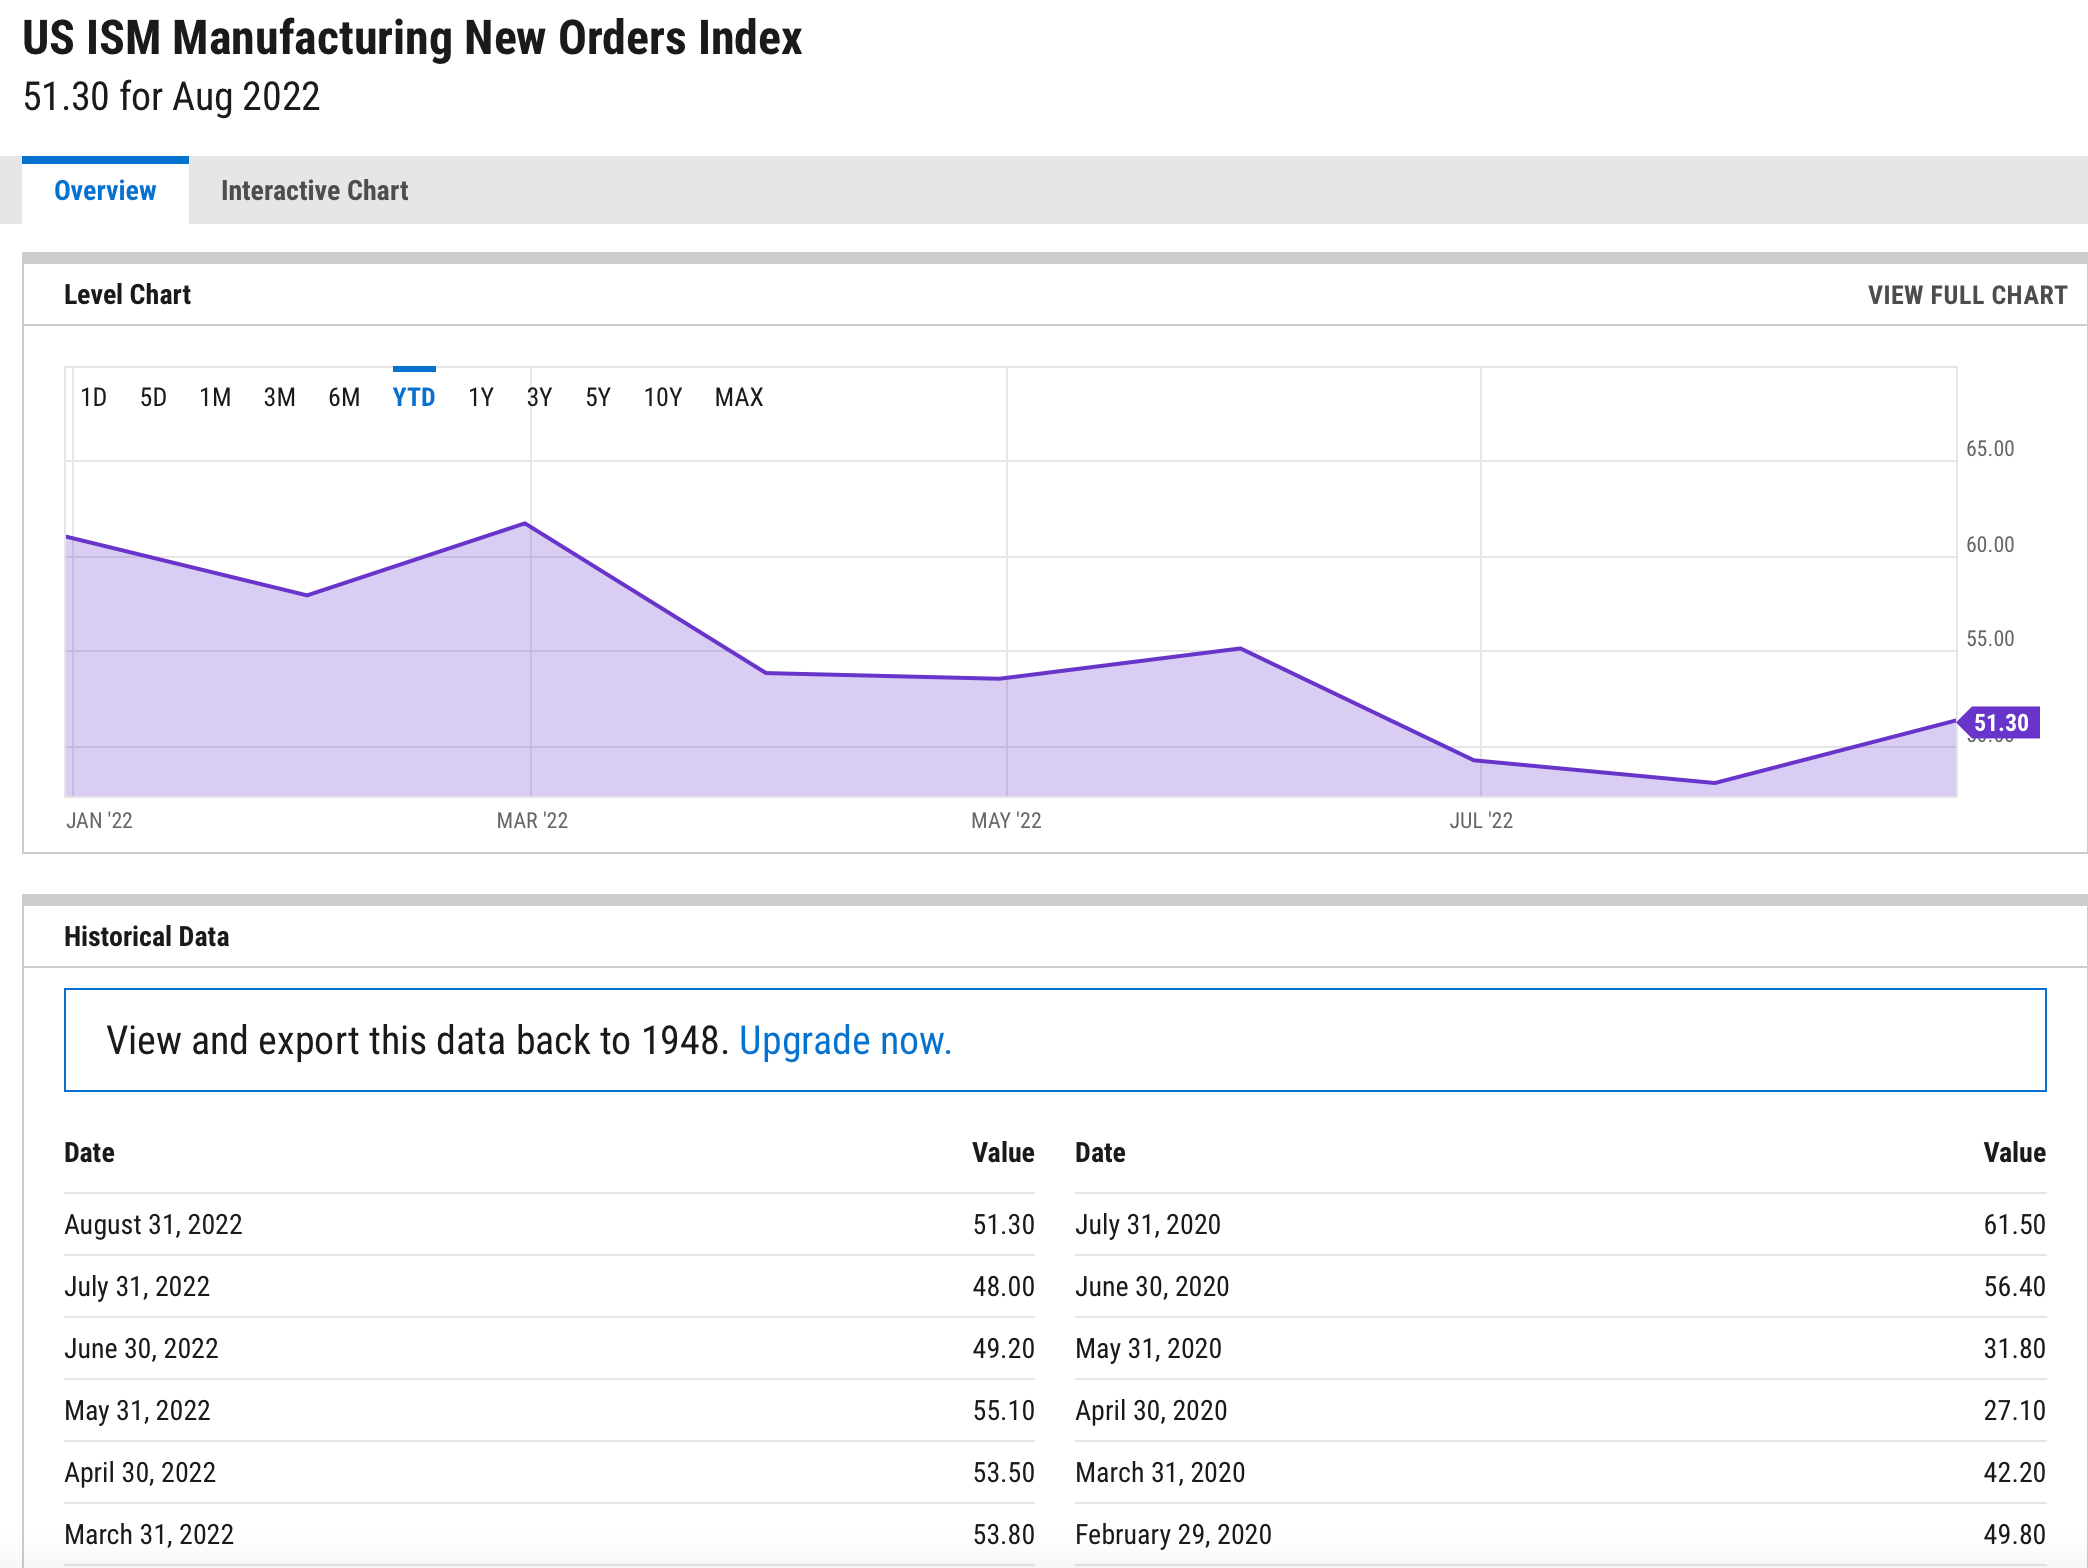
But what has happened since? We have seen this indicator move higher, and above 50 again.
This corresponds with us making our lows in the equity index in June and moving sideways to higher since.
So what does the ISM New Orders Index tell us now? Well, we are now seeing a rising line which is ABOVE 50. If this continues, it would be very good news.
Here is one more.
This is a proprietary leading indicator put together by UBS.
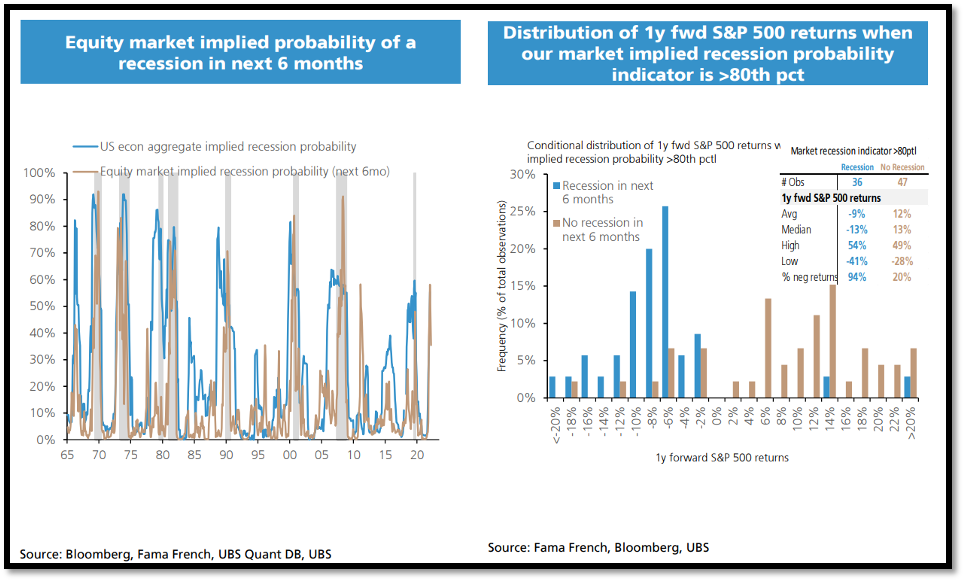
You can see on this chart above that when the brown and blue lines move above the 80% mark (left-handed chart), we have to prepare for the worst.
Over a 1 year period following this indicator hitting 80%, the market has had a negative return 94% of the time.
If the indicator never reaches 80%, the probability of a negative return in 12 months is only 20% with the average return 12 months later of plus 12%.
As of today, we are sitting at 60% and moving sideways.
Looking at these leading indicators as of today, there is reason to be optimistic that the worst may be behind us.
This is very good news except for one problem.
There is one indicator that leads all these leading indicators. That one indicator is interest rates.
The Ultimate Leading Indicator
“Don’t fight the Fed.” - Old Wall Street Saying
When rates move up, it tightens the money supply, making it harder for you to make money.
Rates usually have a lagging impact on the economy.
What does this mean?
When we see higher rates, it usually has a 24-month lag before the rate hike impacts the real economy.
It usually takes 6-12 months to see it in leading indicator activity.
This is the problem we face today.
If we are seeing leading economic indicators down but not distressed and know the impact of rate hikes has not impacted the economy or these indicators yet, what should we expect as we move into next year?
Francis Trahan, the famous Wall Street economist stated this exact problem in 2018 after the fed started to raise rates then:
“The S&P 500 only leads GDP growth by about six months. Here lies the problem for equities then: the bottom in the economy (as per interest rates) is still too far ahead in the future for the window of visibility, or the discounting mechanism of the stock market.”
Since the S&P 500 is a leading indicator, we can substitute the above statement and put in the words leading indicators for S&P 500.
Once the first rate hikes of 2016 started to hit the economy in 2018, the Fed had to quickly reverse its stance doing a 180-degree turn and started to cut rates.
This period is now known as the Powell Pivot.
Rate hikes have a big impact on the markets, but they are often delayed.
You can see below that the US economy has slowed every time the fed has raised rates since the 1950’s.
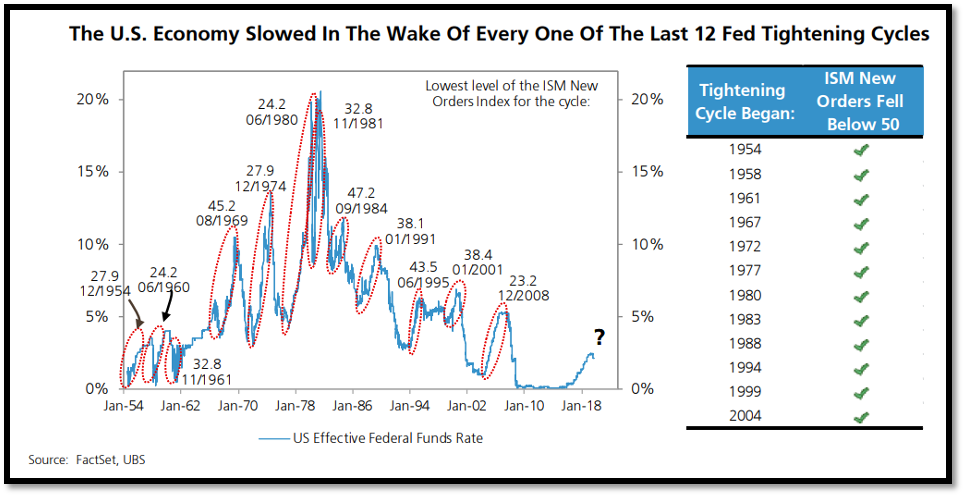
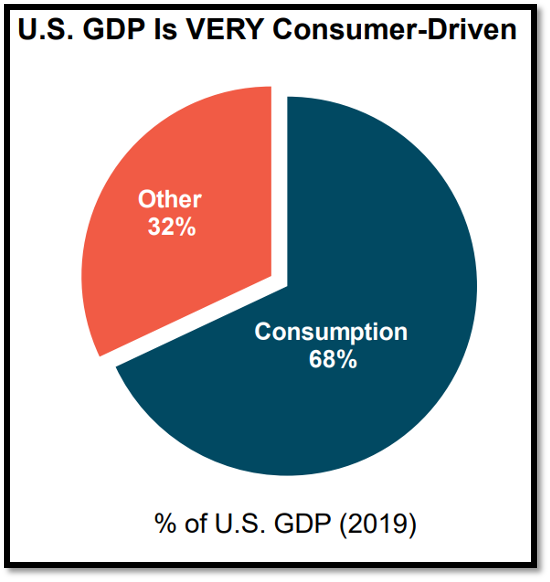
This happens because rates have a direct impact on you as a consumer.
Since your consumption of stuff makes up a significant portion of our economy, interest rates are the ultimate leading indicator.
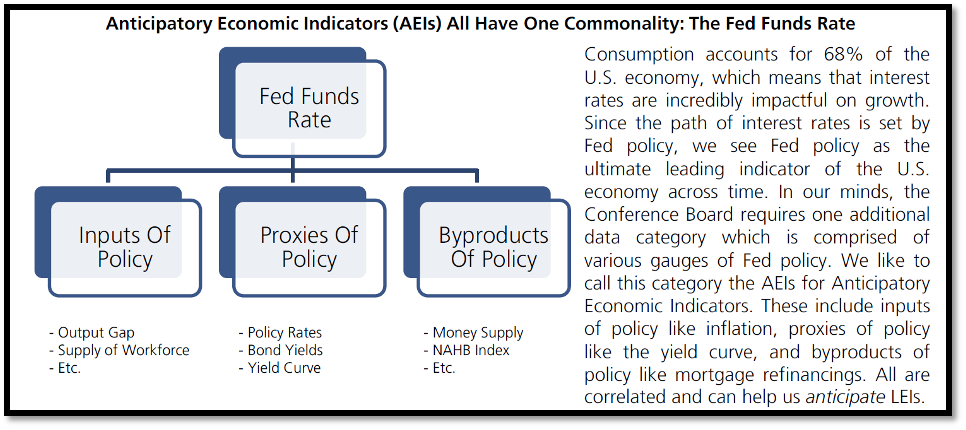
Francis Trahan at Trahan research calls Fed Funds Rates an Anticipator Economic Indicator.
This is one of the main reasons why everyone should have a basic understanding of what the Federal Reserve is currently doing.
You may not like the fact they control your net worth, but it’s all about understanding and playing the game.
So where are Rates Going From Here?
To get an idea of how much further rates may rise, we can look at a few different indicators that impact rates.
We can call these the leaders of the ultimate leading indicator which leads most leading indicators.
As we discussed in the past, the Fed has a double mandate. The first is to control inflation and the second is to have the economy at full employment.
Since inflation is at a 40-year high and employment is at a 50-year low, we know they are focused on one thing - inflation.
We can see below how rates have increased so far this year.
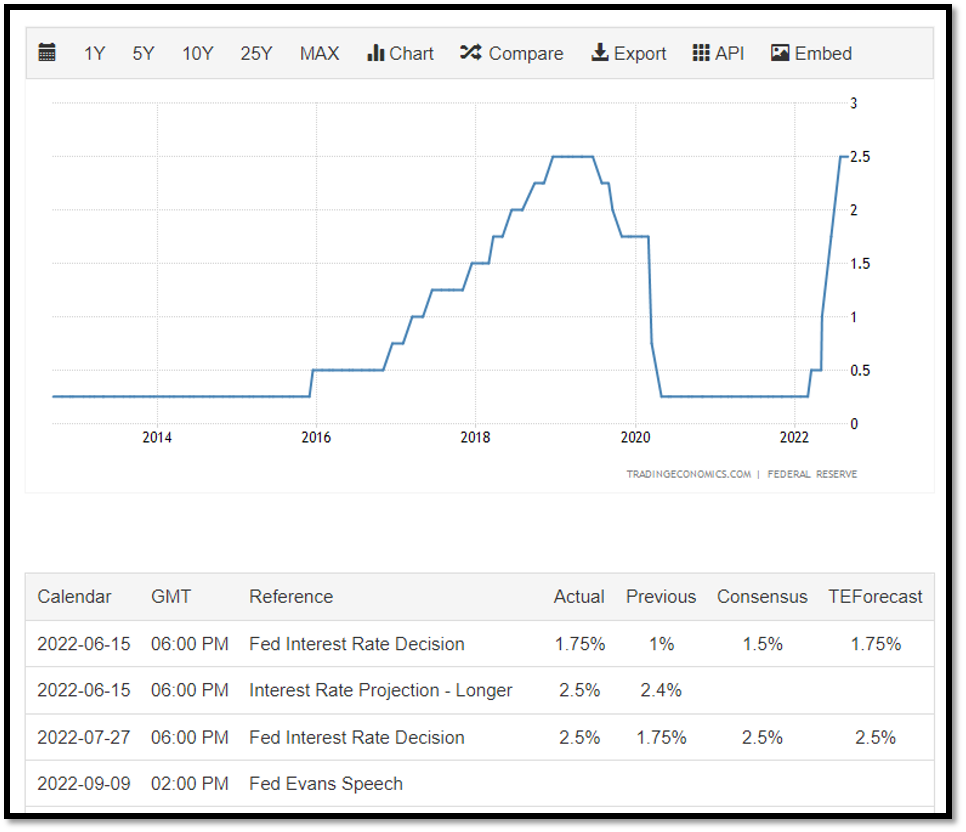
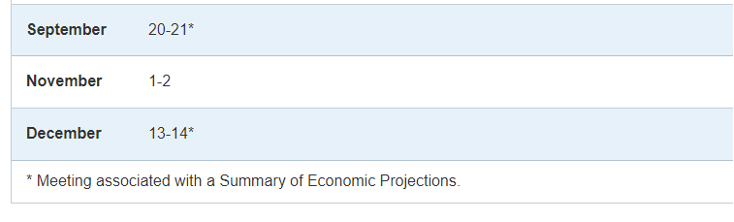
There are three more Fed meetings before the end of the year.
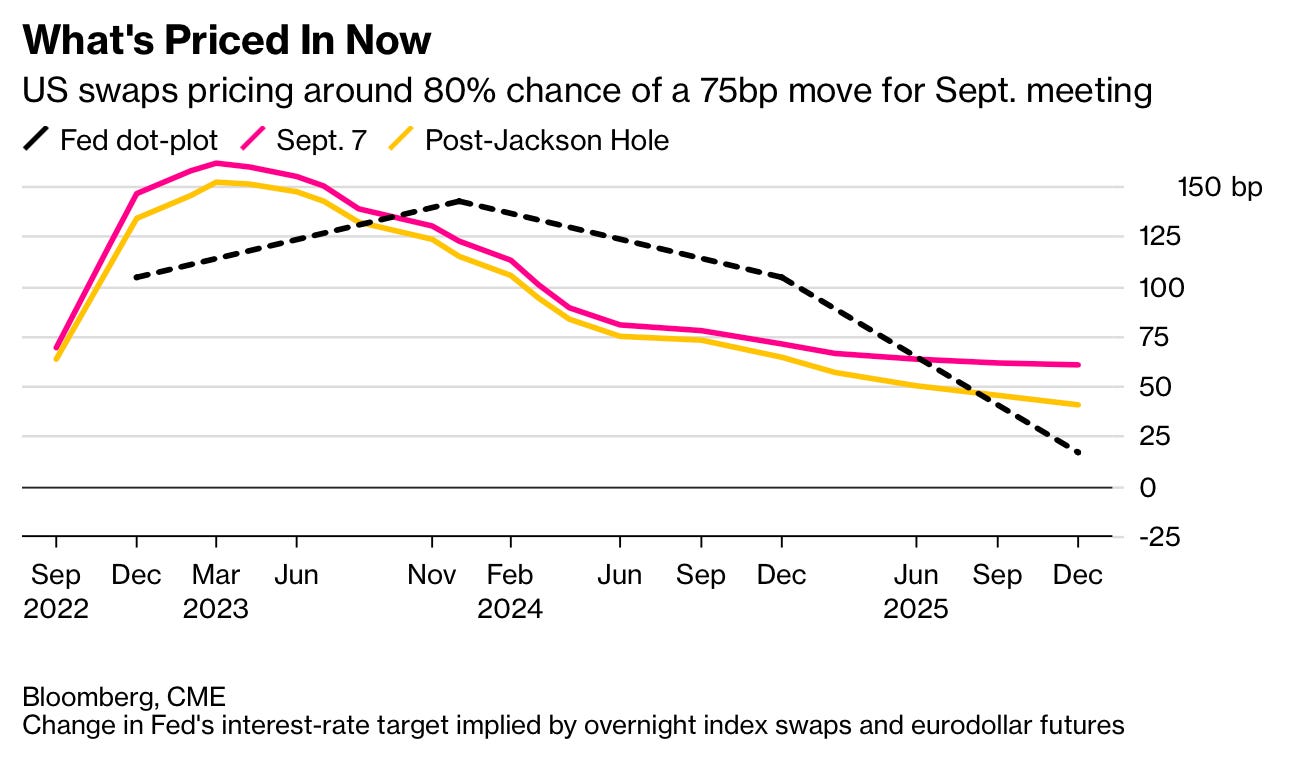
Right now, the street is forecasting another 75 basis points rate hike at the end of this month.
As one Fed official recently stated, we should expect rates at 4% by early 2023 (which is 1.50% higher from here).
Fed Cleveland President Loretta Mester repeated Wednesday that she thinks the US central bank needs to get rates above 4% by early 2023.
The Fed’s main goal in raising rates is to get inflation lower and to weaken the jobs market.
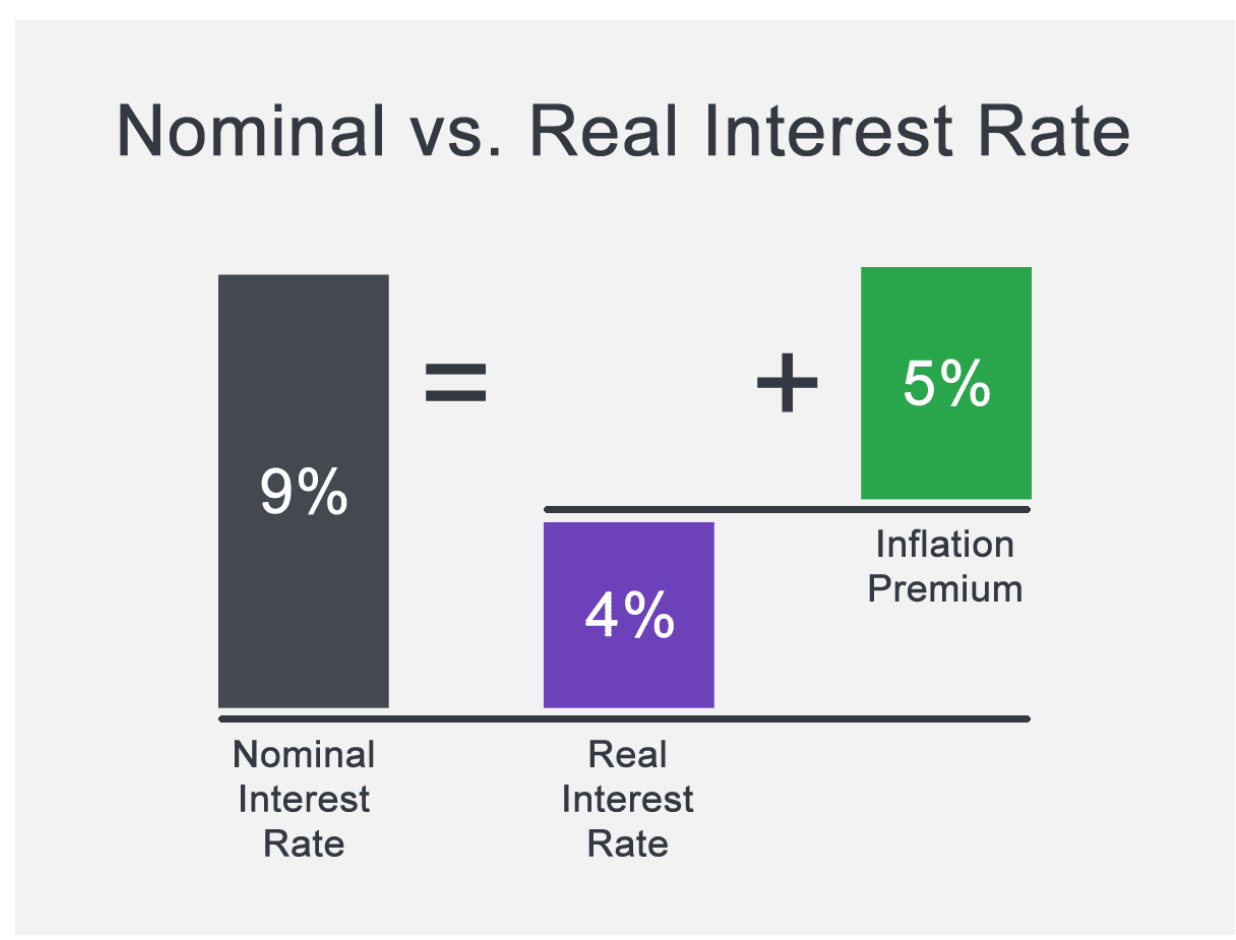
To get inflation lower, they will need to get real rates above nominal rates.
What???
Real rates are just interest rates MINUS inflation.
The theory goes that inflation will continue to be a problem if you have negative real rates.
As you can see below, since the financial crisis, the Fed has had real rates below zero.
They were able to do this because there was no inflation.
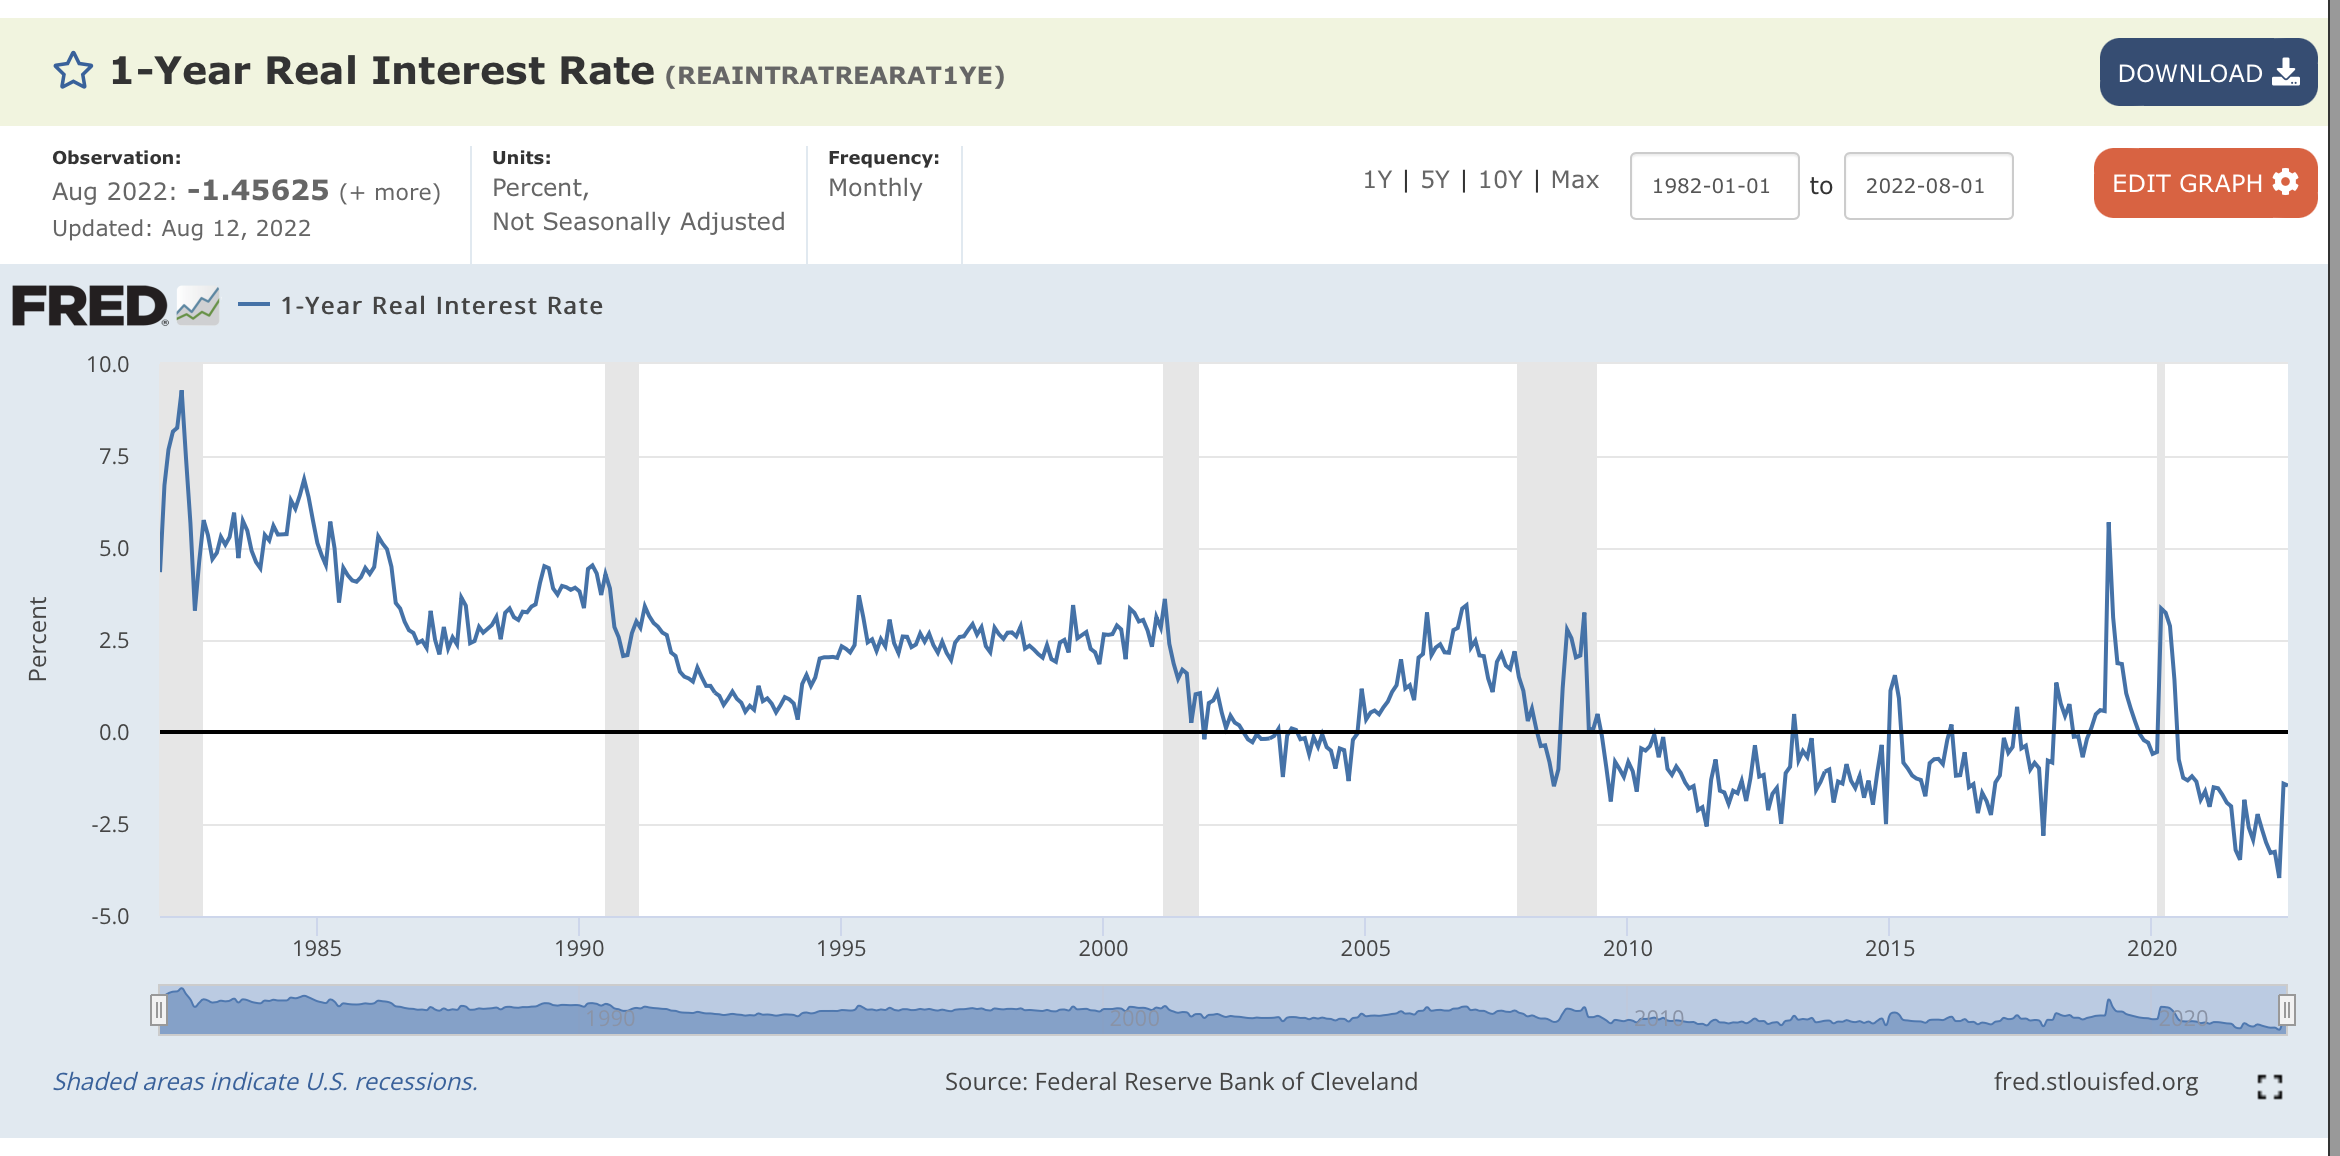
But once inflation gets and stays above their mandate of 2%, the goal then is to get nominal rates high enough, fast enough, to again get real rates above zero.
Until we see real rates above zero through the combination of higher rates and lower inflation, we will not see them stop raising rates.
Besides nominal and real rates, we also have to look at the employment market.
As stated in a recent Bloomberg article:
“You are not going to get inflation back to 2% unless you create slack in the labor market and the jobs report still shows demand for labor is strong,” said Steven Blitz, chief US economist at TS Lombard. “Powell is calling the bond market’s bluff” and he expects a three-quarter rate increase this month from the Fed and that the policy rate will rise to a range of 4% to 4.25%.
Right now we are in a very tight labor market.
By some standards, it is the best-ever employment market for those looking to change jobs.
We still have more job openings than the unemployed.

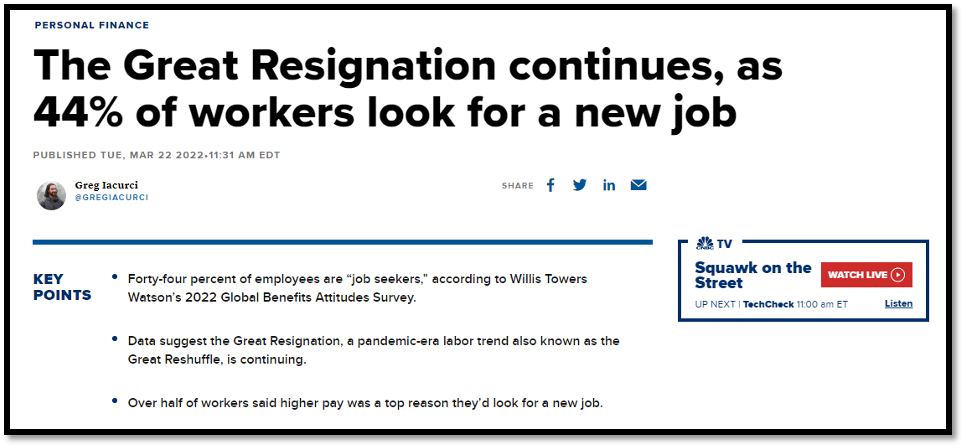
What is the number one reason people change jobs?
You guessed it. Money.
If 44% of the labor force is looking to change jobs, with the assumption they will make more money if they change, then inflation will not go away.
So the Fed will do everything in its power to get the labor market under control.
But raising rates and tightening the money supply is a very blunt instrument.
Like a bull in a china shop, there will be other pain felt throughout the world before they can weaken the labor market enough to impact inflation.
Final Thoughts
We continue to watch leading indicators to help us with our predictive ability about what the future may look like for the world economy and its markets.

While leading indicators are good, we also need to understand their limitations.
Right now, leading indicators are down but not out. Most are showing moderate signs of improvement, which is good. But as we discussed, rates lead most leading indicators and rates look like they are not finished rising.
So here is the ultimate paradox:

If rates are the ultimate leading indicator controlled by the Fed, and the Fed is focusing on unemployment data, which by all measures is a lagging indicator, what ultimately happens?
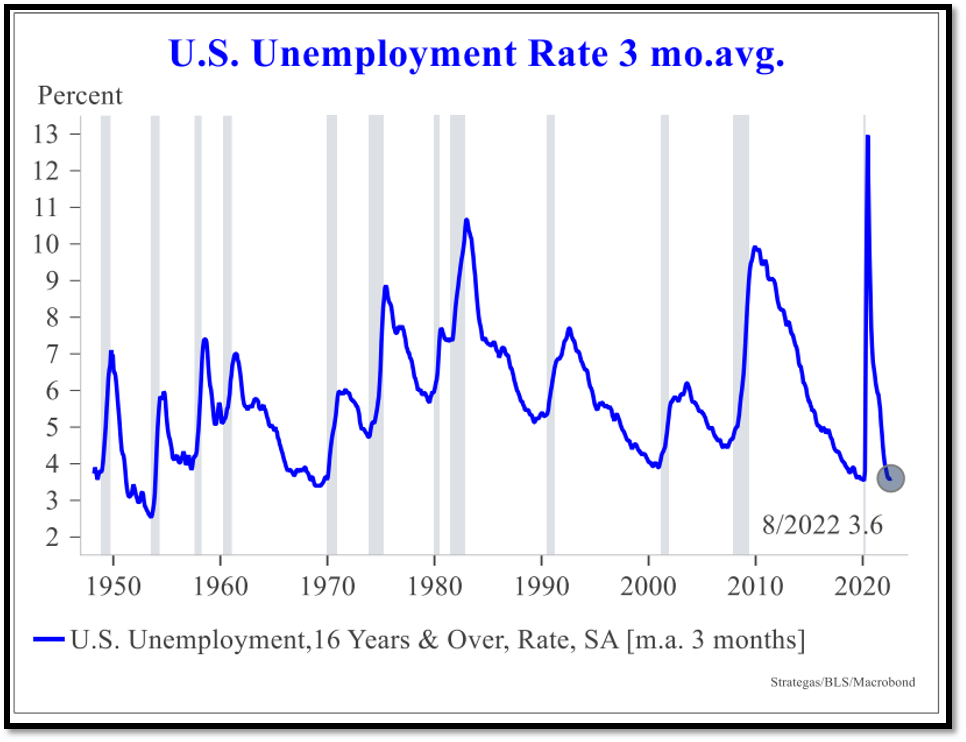
the chart above unemployment always peaks AFTER a recession is over and well after leading indicators have bottomed.
I would love to know your answer to the paradox question above. If you have a viewpoint, let me know in the comments below.
Have a wonderful weekend!!!