

The Feds rate cycle is over…Now what?
The Feds rate cycle is over…Now what?
History Tells us that if you are a trader, you may have some opportunities over the next six to twelve months. But if you are a long-term investor, cash and patience are probably your best bet.

Cartoon of the Week:

Quote of the Week:
“The period of time between the last hike in the Fed Funds rate and the first cut, has been, on average, a decent time to own stocks when not in recession. Believe it or not, the risk during recessions is often most acute after the first cut in rates in a series.” -
Jason Trennert Strategas Securities
The market is pricing in a 79% chance of a pause in the Fed’s next meeting.

This begs the question, what happens when the Fed finishes raising rates?
We took a look at what happens when rates finally top out a few months back. You can find that write-up HERE.

In this past write-up, we discuss the 2-year yield as our guide. More than likely, the 2-year yield peaked on March 8th at a rate of 5.07%.

This means we have clear skies for now, but a potential cat-3 or larger hurricane on the horizon.
Using the data from the previous post, we will not start to see landfall until 150-350 trading days after the peak in the 2- year.
As I will talk in more detail next week, we called this the “phase 3” rally. The hunker-down phase.

There may be some good returns, but if you are not prepared, those will go away quickly when the storm hits.
Phase 3 History
So what does the S&P 500 Index (the stock market index we use for analysis) say the market will do after the final rate hike?

As you can see above, on average the market rallies for a month or two then moves lower.
After a very volatile 3-6 months, the market finds a low and rallies.
This is the average.
Below is the range of that average.

There is a WIDE variation around that average.
As you can see below, the average does not outline what the true impact has been in the past.
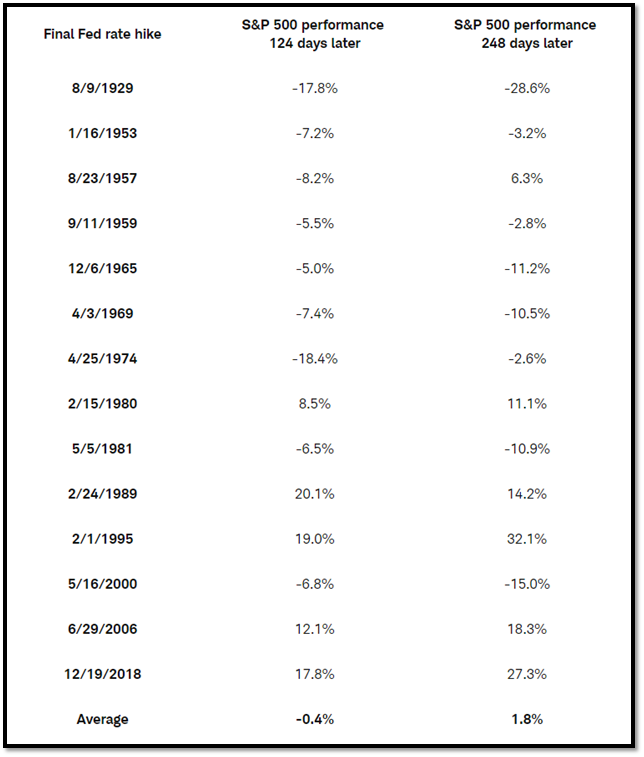
Since 1929, we have seen a total of 14 rate hikes end.
The average return 6 months AFTER the final rate hike has seen the market flat to down. The best return has been a strong 20.10% while the worst return a very ugly -18.40%.
The mean return is -6.00%. This means there are more occurrences on the negative side of the average than the positive.
The key takeaway from this historical analysis:
Volatility will continue to be high, with big swings happening in the market.
Six months from now, we have only a 35% chance of seeing higher returns.
One year from now, we have only a 43% chance of a higher stock market return.
Since 1942, the market has been up 80% of the time year over year (Jan to Dec return).
It does not pay to take significant risks right now in the stock market. This is why we continue to be underweight equities in most of your portfolios.
There have been opportunities, but they are few and far between and all have lined up with a soft landing.
The First Rate Cut
The one area where the market and the Fed are not on the same page is on the next rate CUT.
Let’s take a look at the Fed’s dot plot.

The dot plot is where the Fed’s members feel rates will be in the future.
I wrote in detail about these 19 strangers HERE last week. They are one of the most influential groups of people in the world you never heard of.
Most members feel rates will be at 5.00% OR HIGHER by the end of 2023. We will not see 4% till the end of 2024.
Now let’s take a look at what the market is pricing in.
As of today, the market feels rates will be 4.25% - 4.75% by the end of this year. That means the market is pricing in two to four-rate CUTS between now and the end of the year.

There is a HUGE gap between what the Fed thinks and what the market thinks will happen.
This is the market pricing in a hard landing while the Fed continues to preach of a soft landing.
Looking at the historical data below from the last rate hike to the first-rate CUT, the median length has only been 4 months!!!

Between the last hike and the first cut, historically the market has been higher.

This goes along with the phase 3 thought process I talked about above.
Now look at the percentage change from the last hike to new market lows. The average is down over 22% with the median down about 20%!!!
Phase 3 gives some opportunities for gains, but quickly takes them away. This is because while the Fed finishes its rate hikes, the full effect is not felt yet in the economy.
The market thinks the worst is behind them only to have the cliff is right in front of them. You are picking up cents in front of a steam roller.

With the equity market multiple already near 20X earnings, it is hard to see the market move significantly higher from here.

Looking at the chart above since 1990, the multiple today is still higher than most other periods in history.
And this is before revenue and earnings growth start to turn negative.

If earnings turn negative, all else equal, the multiple on those earnings will move higher.
Something will have to give sooner or later.
Cash is the best place right now until further notice
There is a battle right now between the market and the Fed.
The Fed controls the short end of the curve while the market controls the long end of the curve.
Since the Fed thinks rates will stay higher for longer the short-end has the highest yields.
You can receive a higher yield in cash, money markets, and 1-2 year treasuries than if you invested your cash in 10 or even 30-year treasuries.

This is called an “inverted yield curve”.
Normally, the further you go out in years, the higher the yield (blue line below).

But today, the curve is inverted (red line).
Inverted yield curves are never a good sign for the economy.

When the yield curve inverts, things stop working.
The inversion of the yield curve is like you being right in the middle of the hurricane cone of uncertainty.

You don’t know when it will hit but you do know it’s coming.
So with the risks for a potential move lower in stocks in the next 6-12 months, and cash offering a great return, why not take advantage of what the market is giving you?
Cash is the best risk-adjusted return out there at the moment. I have no idea what returns will be over the next year. As we showed above, if we do have a soft landing, stock returns will be MUCH higher than today. But history tells us this is a very low-probability event. When we adjust for the risks and probabilities in the market today, cash is the place to be.
Looking at the graph below, you can see right now you are getting a return in cash that is equal to or higher than most other areas in fixed income that have higher risk profiles.

Now look at the dotted line. That is stock market earnings yield (inverted PE). This line historically is 4% to 8% above the return of cash. This spread above cash is the price you get paid for taking the risk of equities.
But right now, that spread is less than 1%. The equity market, with a PE multiple of 20 times earnings (we highlighted above) is EXPENSIVE vs the cash market.
Either rates need to move lower or the equity market multiple needs to move lower.
This opportunity in cash will not last. Within the next 6-12 months this opportunity will be gone. So get yours while supplies last 😊

Have a great Weekend.
LEGAL STUFF
This commentary is for informational purposes only. This material is not intended to be, nor should it be construed as financial, legal, tax or investment advice and does not constitute an opinion or recommendation by Enlightened Amadan or its author or the author’s employer. You should consult appropriate advisors concerning such matters. This material presents information through the date indicated, is only a guide to the author’s current expectations, and is subject to revision by the author, though the author is under no obligation to do so. This material may contain commentary on broad-based indices; economic, political, or market conditions; particular types of securities; and/or technical analysis concerning the demand and supply for a sector, index or industry based on trading volume and price. The views expressed herein are solely those of the author and not of his current employer. This material should not be construed as a recommendation, or advice or an offer or solicitation with respect to the purchase or sale of any investment. The information in this report is not intended to provide a basis on which you could make an investment decision on any particular security or its issuer.
Certain information has been provided by and/or is based on third-party sources and, although such information is believed to be reliable, no representation is made with respect to the accuracy, completeness, or timeliness of such information. This information may be subject to change without notice. Enlightened Amadan and its author shall not be liable to any person in any way whatsoever for any losses, costs, or claims for your reliance on this material. Nothing herein is or shall be relied on as, a promise or representation as to future performance.
PAST PERFORMANCE IS NOT INDICATIVE OF FUTURE RESULTS.
Any financial instruments mentioned herein are speculative in nature and may involve risk to principal and interest. Any prices or levels shown are either historical or purely indicative. This material does not consider the particular investment objectives or financial circumstances, objectives or needs of any specific investor, and is not intended as recommendations of particular securities, investment products, or other financial products or strategies to particular clients. Securities, investment products, other financial products or strategies discussed herein may not be suitable for all investors. The recipient of this report must make its own independent decisions regarding any securities, investment products or other financial products mentioned herein.
© 2023 Enlightened Amadan