

What is the Lag Effect of Interest Rates?
What is the Lag Effect of Interest Rates?
The Lag Effect of Rates, Impact on Housing and Manufacturing, and a Look at Silicon Valley Bank Implosion. Are the canaries chirping?

(7-minute reading time)
Cartoons of the Week:


This week Ken Griffin, the CEO of Citadel, one of the biggest hedge funds in the world, sat down with Bloomberg in Palm Beach to give a talk.
During this talk, he said something really interesting about the Federal Reserve Process in fighting inflation.
Take a watch:
“It’s like doing surgery with a dull knife.”
We really have no idea what the lag effect of Fed Rate hikes are on the entire economy.
I had a conference call this week with Bryon Wien, the Vice Chair of Blackstone, and Joe Zidle, the Chief Investment Strategist at Blackstone. I ask this specific question about the lag effect.
Their reply:
“Stocks are not the economy – in 2022 we felt it was a better economic growth year, but with higher inflation, which was bad for the markets. Most of the economy, as of today, is working off 0% interest rates. Monetary policy has a 2- to 3-year lag on the average company and person in the economy. Every part of the economy is still comping off 0% rates, so while this effect may start to impact the economy in 2023, the markets may have felt a lot of that pain already.”
So while the market is focused on how HIGH interest rates will go, I think we all need to look at this a bit differently.
The better question to ask, in my view, is how LONG will rates stay at these levels or higher.
To get in indication of how current rates may effect the markets over the next 12-36 months, we have to go back to something Mr. Griffin said in the clip.
“Usually housing and manufacturing are impacted first.”
If this is the case, could we not look at housing and manufacturing NOW to get an idea of what our lives may look like in two years, if rates stay at this level?
More importantly, what will be the lag effect for these different areas if rates stay elevated?
Let’s take a look….
Housing
As we all know, mortgage rates have adjusted quickly.

Per housing participants in the “know”, pain is being felt.

This pain is not just from the increase in mortgage rates, but also the ability to get a mortgage. Banks are tightening their purse straps.

In real time we are seeing housing stall, banks choking off lending, and borrowers just not willing or able to take out a new loan.
But these policies have NO impact on those who have purchase a home in the last 10 plus years. Your rates are locked in, so any changes really do not matter to you.
This is the lag effect.
If you locked in your mortgage, you will not really need to worry about rates until you sell or look to move. If rates move lower again, no harm, no foul. But if they stay at this level or higher, rates will have a HUGE impact on your decision making process.
The pain in housing right now is real. If this is an indication of what the future may hold, we are in for a bumpy ride.
Manufacturing
One of the easiest way to get a feel for how manufacturing is doing right now in the US is through the Purchasing Managers Index or PMI. A PMI reading above 50 percent indicates that the manufacturing economy is generally expanding; below 50 percent indicates that it is generally declining.
You can see below, we are currently below 50.

This weakness has been led by New Orders by manufacturing firms, which have looked horrible till last month.

As Francois Trahan stated recently in one of his macro research reports:
“I have been showing the chart of the S&P 500’s return alongside another component of the LEI, the ISM New Orders Index, since the late 1990s. The correlation between these two series has been significant for over 70 years but it’s been especially tight in the last few years. In essence, if you know where PMIs are headed, you can gain a tremendous amount of insight to the likely trajectory of the stock market.”
Rates moving higher has choked off some demand for manufacturing today.
As PMI data is a leading indicator, this may be a sign of some trouble ahead for our economy.
But what may be the lag effect for US manufacturing and on all US companies?
Well, when we look at US company debt levels, it has exploded over the last few years.

As of February 2023, per the S&P indices, the average coupon payment (or interest rate on this debt above) is only 2.69%!!!
With rates on the 2-year treasury at 5%, interest paid on debt outstanding is extremely low, and as a result, companies are still very healthy when looking at their balance sheets.
One way to measure the level of health is with interest coverage, which is just company earnings divided by their interest costs (EBITDA / interest expense).

The same can be said for high yield and leverage loan companies (smaller, more risky companies).
Debt levels have exploded…

But their interest coverage is the best we have seen since the 1990’s.

The BIG lag effect on all these companies is when the debt comes due.
If rates move lower, it will not be a big impact at all on companies and their debt. But if rates stay at this level or higher through 2025 to 2030, and we have the big wall of debt coming due, as you can see below, companies will be forced to refinanced at a much higher rate or use cash to pay off their debt.

If rates stay higher for longer, expect lower earnings from companies in the coming years or huge cost cutting initiatives.
As you already know, in corporate America, the easiest way to cut costs is through the reduction of labor.
The US Consumer
So far employment has stayed strong, giving the consumer a strong base to continue to spend money.
Why is this?
As I was thinking about this question driving my kids to school, this came on the radio.
Does Carl Weinberg from High Frequency Economics have a point?
When we look at disposable income, you can clearly see in the chart below, we are above trend line since COVID began. (blue line is disposable income, dotted line is trend line).

Since rate hikes instantly shown up in CD and money market rates, this excess savings is getting a shot in its arm with a thing called interest income.
If Mr. Weinberg comments of having $2 trillion dollars more in the economy in cash balances is correct, and this money is now receiving 4% type interest income sitting in the bank, that is an extra $80 billion a year into our economy.
Now $80 billion is not a whole lot when looking at our economy which is $23 trillion a year, but psychologically, it could have definitely have an impact in the short-term.
The Fed knows this. And that is why they are trying to suck liquidity out of the market as fast as they can.
The longer rates stay higher, the more liquidity will be sucked out through higher inflation right now, but also higher interest rate levels or less cash levels than before.
As you can see below, we are already in record breaking land when it comes to the liquidity suck. Liquidity and cash in the market called M2 has been shrinking over the past year. This measures the growth rate of money in circulation in banks, CD’s, savings, and money markets.

We have officially gone into a negative growth rate YOY. There has been only four other times this has happened since 1870.
All others led to a very bad outcome.
As Mr. Weinberg said in the clip, we are seeing in real-time the adjust of prices higher at the same time seeing the Fed do everything in their power to suck the liquidity out.
This will eventually be a death nail for inflation, but at what cost to you, me, and corporate America?
We are already seeing the impact of inflation taking its toll.
To keep up your spending, consumers have stopped saving and are ramping up their use of debt.
As you can see below, the blue line is savings rate and the red line is loans outstanding like credit cards.

The trend does not look good.
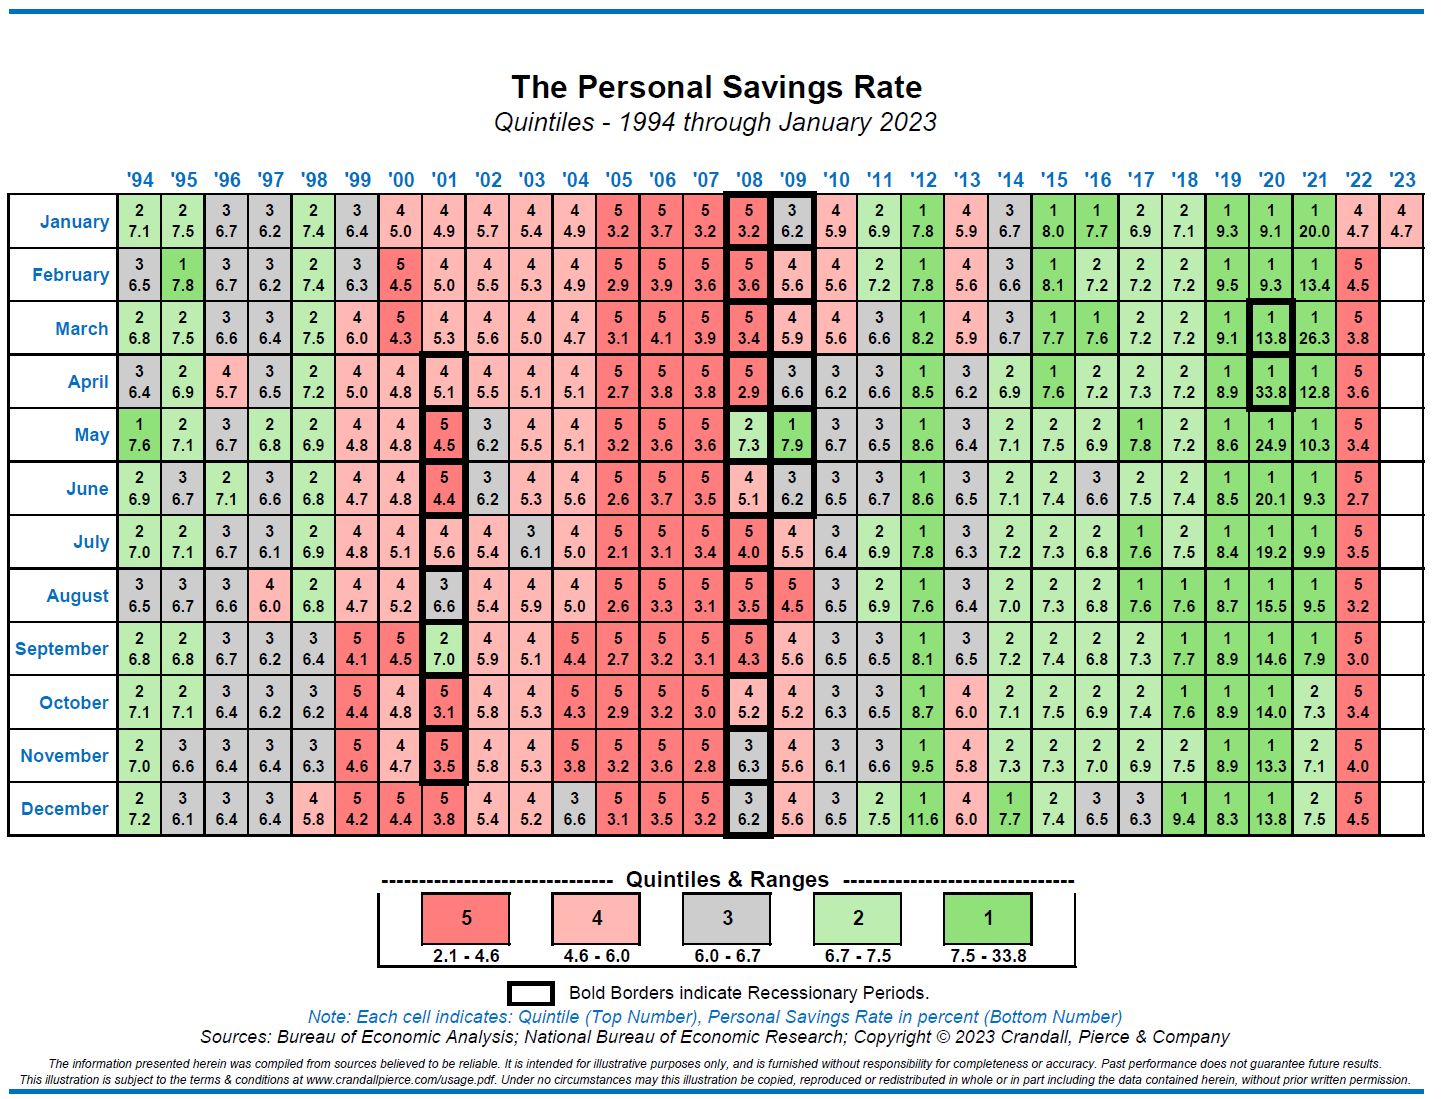
Below is a chart highlighting savings rate since 1994 per month. The red boxes are the lowest quartile of savings rate over this time period.
Every time we see red, eventually a recession happens (dark black boxes). Eventually the consumer gets tapped out.
The lag effect of higher rates for longer on you is clear. Prices will not drop from here. If inflation moves lower, they will stall out, but the prices you pay on your debt will be much higher, forcing you and every other US consumer to spend more on debt servicing and less on goods and services.
Since 70% plus of our growth as a country is driven by the US consumer spending habits, this lag effect may be difficult for economic growth.
The Unknown Unknowns
As the old adage goes,
“When Rates go Up, Things Blow Up”!!!
We are seeing this in real time with SIVB bank the last two days.
This bank received a ton of inflows of money over the last few years. Over the last few years, SVB saw deposits, (due to all the investor capital flowing towards private investments/VC), jump from $61.76bn at the end of 2019 to $189.20bn at the end of 2021.
Let’s take a look at the M2 money supply growth chart again. See the HUGE spike higher to the far right?

That big spike was the Fed printing unlimited money. The money had to go somewhere. Deposits in banks where one of those places.
If you are a bank, the only way you make money is to loan out the money you receive in deposits in the form of loans with higher rates (think mortgages). The bank pays you 0.10% in checking interest while they loan our your money to someone buying a house at 5%. The difference of 4.90% is the profits of the bank.
SVB bank deposits came in fast and they could not grow their loan book fast enough to keep pace. As a result, someone at the bank decided to purchased a large amount (over $80bn!) in mortgage-backed securities (MBS) with these deposits with a 10 year duration, with a weighted average yield of 1.56%. Ouch….
When rates moved higher, the bank took on HUGE losses. As of yesterday, they announced that they had sold $21 billion of these securities at a $1.8 billion loss, and were looking to raising $2.25 billion in equity and debt to keep the lights on.
The same investors who flooded this bank with deposits from 2019-2021 are now pulling their money in droves. This is called a “run on the bank”.
A stock Jim Cramer recommended as one of the top 10 names to own in 2023 at $320 per share is now trading at less than $40 a share one month later.

Per the news today, regulators have shut the bank down, with FDIC protecting some of the depositor bases assets, but not all of them. If you had more then $250,000 deposited with this bank prior to today, that money may be gone.
This is the news of today. Back in September, it was the British Pension System as I talked about HERE.
On this news, we are seeing yield tank across the curve and investors are YET AGAIN, pricing in a Fed Rate cut at the end of 2023.
All this is direct cause of excess liquidity and the Fed trying to suck back this excess liquidity.
The news today is part of the unknown unknown. Things we have no idea that may happen that lay right under the surface, ready to boil.
The longer we see rates stay elevated, the higher the risk of these type of events happening. We will all have to adjust to higher rates eventually, it just takes some longer then others to feel the effect.
Have a wonderful weekend….