

Peak Inflation is Here -Is it a Perfect Set-Up for a Santa Clause Rally???
Peak Inflation is Here -Is it a Perfect Set-Up for a Santa Clause Rally???
Peak Inflation - Rental Price Calculations impact on Inflation - Student Loan forgiveness info...

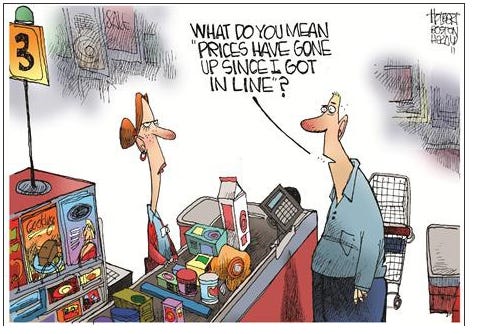
Cartoons (and PICTURE) of the Week:

Peak Inflation? Let’s Hope
We all have felt the pain of rising prices over the last 12-18 months.
Below you can see a very long-term snapshot of CPI, the key measurement of inflation. We have not seen these types of numbers since the 1970s and early 1980s.

In my understanding of the key drivers of this index, I am now hopeful this persistent rise in inflation may be coming to an end soon.
Let’s discuss:
What is the CPI?
CPI is the main measurement used to judge inflation trends within the economy.
Inflation is just the rate and pace the price of everyday goods goes up or down.
Here is the description of CPI from the Bureau of Labor Statistics:
“The CPIs are based on prices of food, clothing, shelter, fuels, transportation, doctors’ and dentists’ services, drugs, and other goods and services that people buy for day-to-day living.
Prices are collected each month in 75 urban areas across the country from about 6,000 housing units and approximately 22,000 retail establishments (department stores, supermarkets, hospitals, filling stations, and other types of stores and service establishments). All taxes directly associated with the purchase and use of items are included in the index.
Prices of fuels and a few other items are obtained every month in all 75 locations. Prices of most other commodities and services are collected every month in the three largest geographic areas and every other month in other areas. Prices of most goods and services are obtained by personal visit, telephone call, or web collection by the Bureau’s trained representatives.”
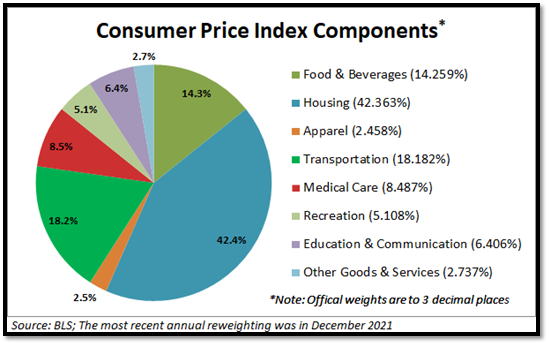
In essence, the CPI is made up of different components of your daily spending habits.
As you can see below, housing (mainly made up of rental prices) is a big piece of the pie. Others are transportation (gas, car prices, etc), and food.
What was the latest reading?
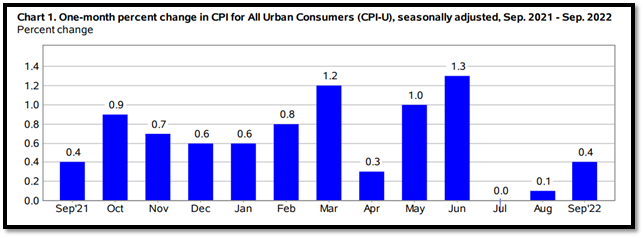
This past month saw yet again record high inflation numbers for September, with an 8.2% inflation rise year over year.
Below is a snapshot of month-over-month changes. If we used this past reading and ran it out for 12 months, we would have a 5% inflation rate in a year (0.4 * 12 months). An 8% yearly inflation rate is about a .666% monthly rate (8/12).
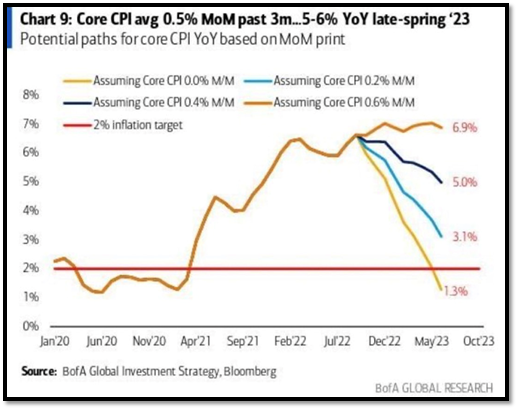
Below is a snapshot of what we can expect moving forward, depending on different month-over-month inflation readings.
What drove inflation higher this month?
This past month, we saw a number of the inputs that go into the CPI number move lower.
One of the inputs that moved higher really stuck out. Rents.
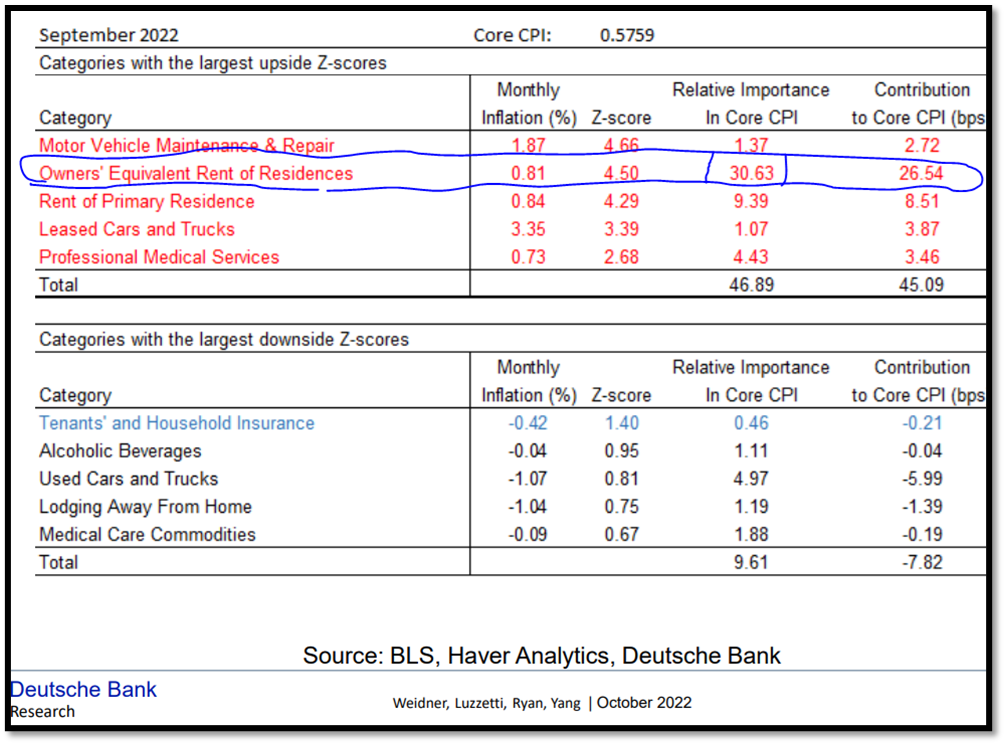
As you can see below, the red items are the inputs that had outsized higher inflation on a monthly basis.
The one I highlighted in blue is rental and home prices, also known formally as Owner equivalent rent of Residences. This makes up almost 31% of the entire CPI measurement and had a large impact on the higher inflation data in the month.
Rental Data
Real-time rental data differs dramatically from what the CPI reading stated.
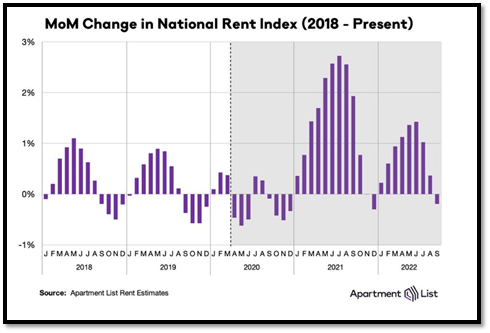
As you can see below from the Apartment List, rental prices have turned negative over the past month.
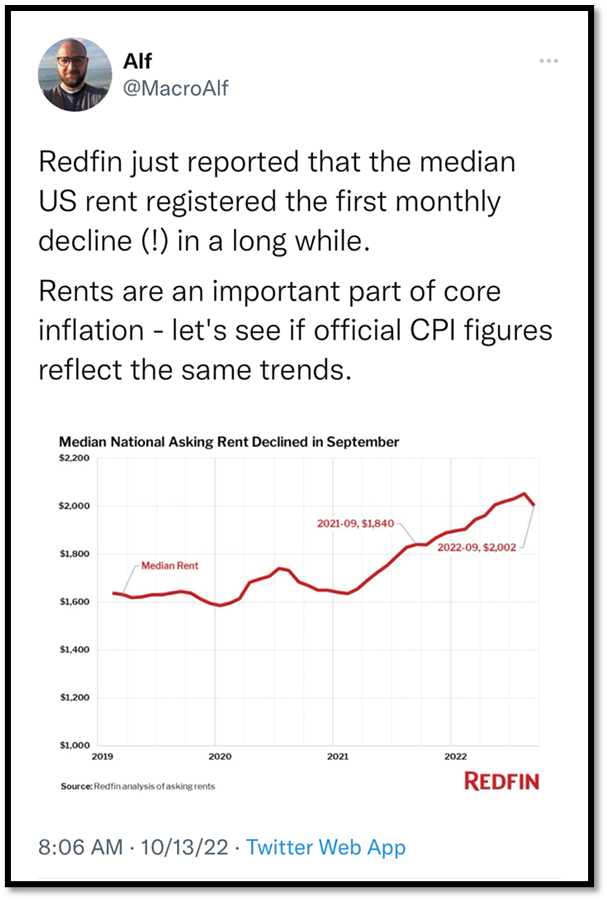
Below is another data point from Redfin highlighting the fact rental prices YOY are finally turning negative.
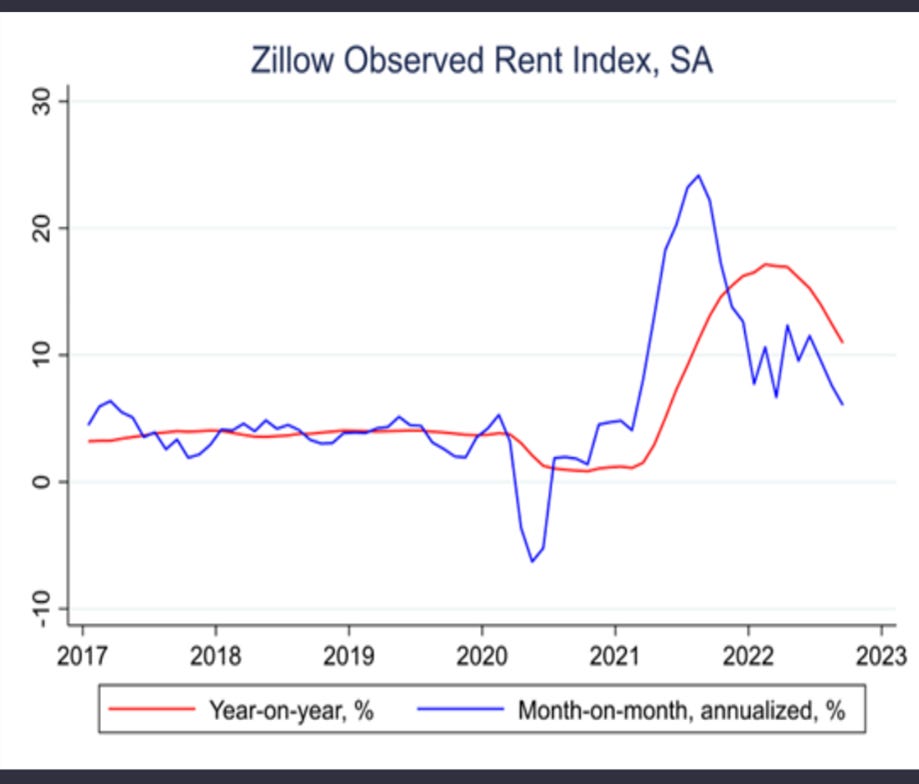
And finally, below is the information from Zillow highlighting the big turn in rental prices over the past 3-6 months.
So if the data above shows real-time rental data moving lower, why in the heck is the CPI input for housing and rental prices moving higher?
CPI Rental Input Calculation
CPI rental pricing is a lagging indicator.
This was seen clearly last year as rental prices skyrocketed higher but showed minimal signs of a rise in the CPI.
Below is a Twitter discussion on this topic.
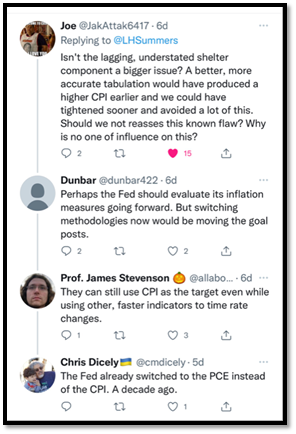
What is unique about rental data for the CPI is the way it is calculated.
Unlike milk, gas, or food items that you consume on a daily basis, most renters only see their rental price move higher or lower every 12 to 18 months.
To factor in this lag effect on you, Mr. and Mrs. consumer, the Burrow of Labor Statistics does not use spot price inputs as we highlighted above.
When the data of over 50,000 rental units are collected, they are using both new leases signed as well as existing leases already in place.
This smooths the effects of rent price changes, impacting the CPI reading. In periods of strong rental growth, like 2021 (look at the purple spike in the chart below for 2021), these effects are not fully seen in the CPI data till at least 6-12 months later (big spikes below in the middle of 2021 are being felt now).
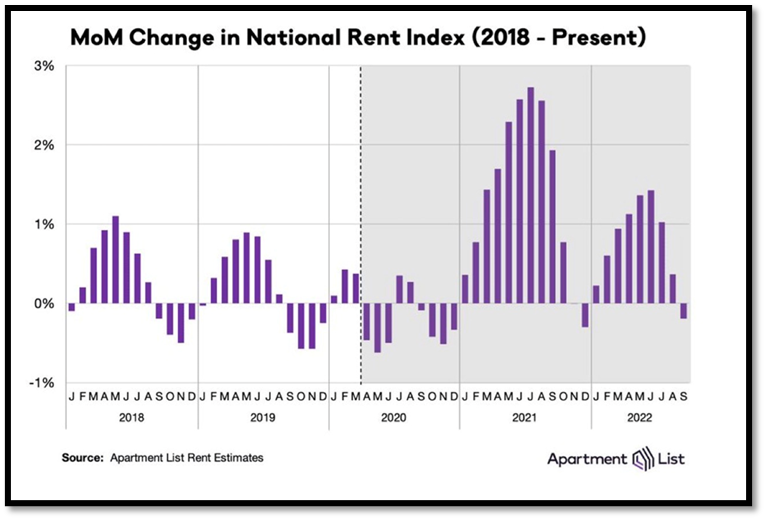
So while we have seen a clear slowdown in rental prices (the last purple line on the right below 0%), this impact will take another six to twelve months to be fully seen in the inflation data.
As Larry Summers highlighted in a white paper on this subject:
“Dolmas & Zhou (2021) documents that historically the BLS measure of 12-month change in rental prices is more strongly correlated with the 12-month change in housing prices observed 16 months earlier than any more recent reading.”
Owners’ Equivalent Rent (OER) is an input into the CPI that measures the price of our homes. Again, usually, a purchase of a home is a once-in-a-lifetime activity, so it’s hard to judge this change on you measured on a monthly basis.
To adjust for this, the OER uses a statistical technique to infer home price changes using, you guessed it, rental prices of similar units in your area.
Again, going back to 2021, when home prices around the country exploded higher, that was not seen in the CPI inflation index till the rental prices increased. Once rent spiked, that started the wave effect impact on the CPI which we did not start to see till mid-2022.
Conclusion
Inflation has historically worked in cycles.
As you can see below in the chart provided by Strategas, during past inflation cycles, 16 months after the peak in inflation, we usually saw inflation about 1% higher than when it started.
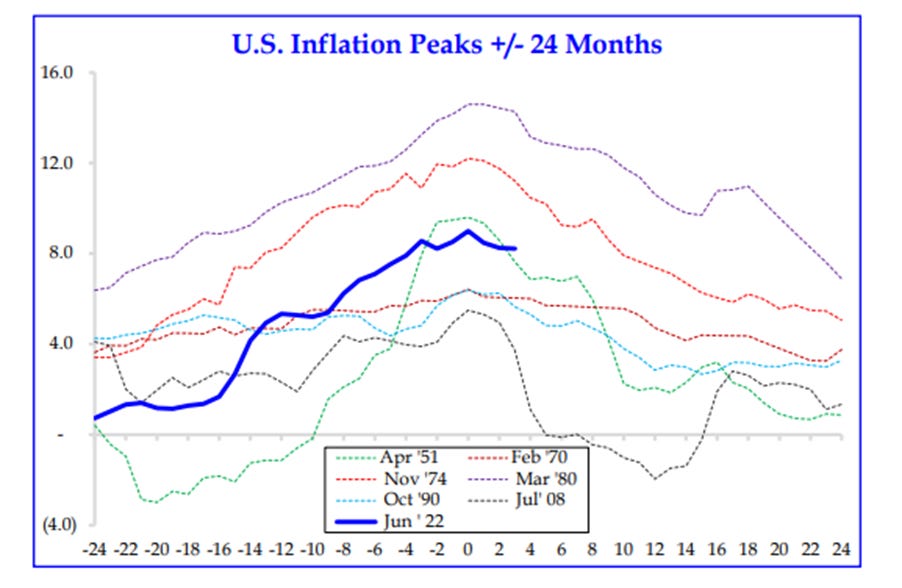
This cycle of inflation started at 1.68%, so using history as our guide, we can expect inflation to move down to 2.50% - 3% by Christmas 2023, when rental decreases have fully been priced into the CPI data.
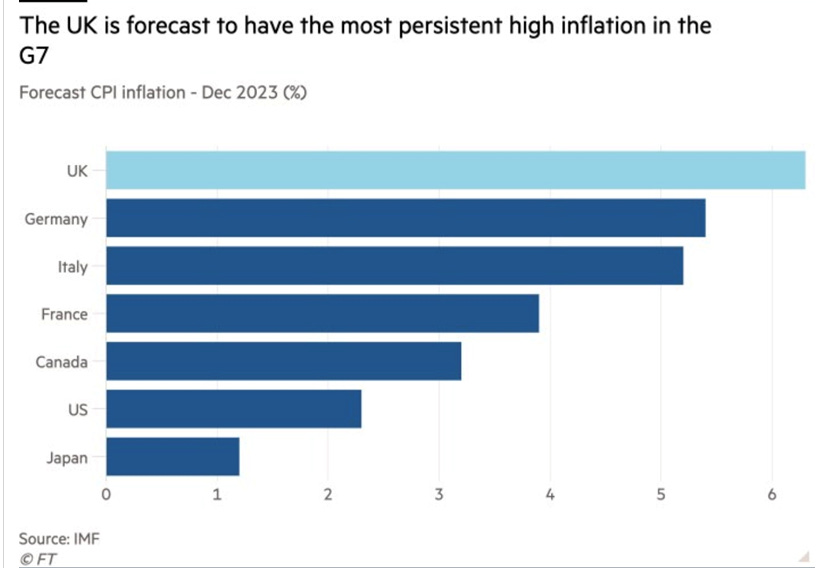
The IMF this week came out with their forecasts for CPI inflation for different G7 countries around the world.
As you can see below, they are forecasting US CPI to be about 2.5% by December 2023, right in line with our analysis above.
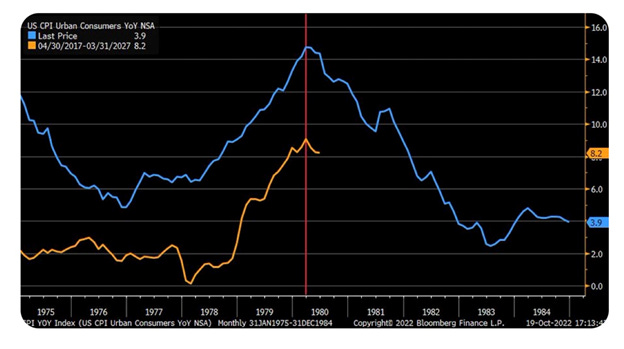
Below is a different viewpoint of the same exercise above. This one, provided by Liz Ann Sonders, shows inflation from the LATE 1970s (blue line) overlying inflation from today (orange line).
If this trend plays out like the LATE 1970s as our guide, we should be close to peak inflation and be well on our way to lower normalized inflation by the end of 2023.
One thing not highlighted in the chart above using the 1970’s is what it took to get inflation back to “normal”. As you can see below, we expereienced two back to back recessions in 1980 and 1982 to get us back to normal.
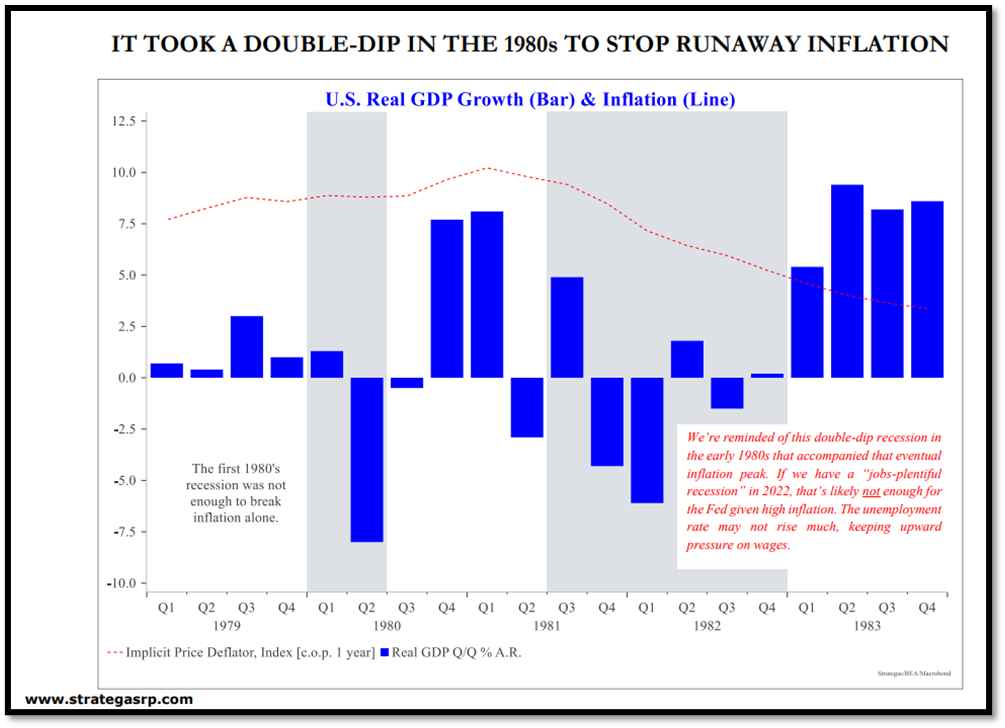
Will we look back in 10 years and highlight the same thing? A technical recession in the first half of 2022 and another more normal recession in mid-2023? Only time will tell.
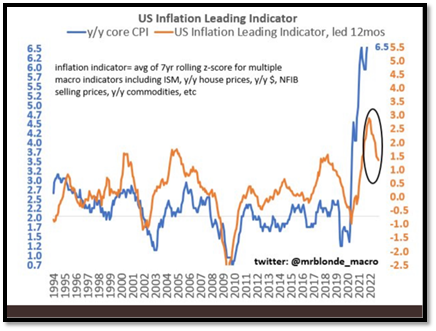
I wanted to share with you one more chart before we get off this subject. Below is a chart of inflation-leading indicators. The yellow line circled to the right is the leading indicator, which shows we have seen a number of inflationary inputs move lower. the blue line (CPI) should quickly follow.
As I discussed two weeks ago HERE, I feel we may be setting up for a decent rally in the fourth quarter.
Inflation data should move lower over the coming months which will increase the talk of peak inflation and help push the markets higher into a year-end Santa Clause rally.
If the international markets can hold on and not “blow up” (think a big bank in Europe going under) as we discussed almost happened in the UK HERE a few weeks back, the ugliness we saw in the third quarter should be the low water mark for returns in 2022.
I am hopeful the fourth quarter can squeak out a gain and give some positive signs for the markets and economy as we move into 2023.
FINALLY: Student Loan Forgiveness
No matter your viewpoints on this subject, it seems the process has officially started.
If you qualify, there is no reason not to apply and take advantage of this opportunity.
This week the website opened up to officially apply. It is a quick questionnaire that will take less than 5 minutes to fill out.
By going to studentaid.gov , you will be taken to the application to apply for student loan relief.
Any individual who has federal student loans outstanding (not private loans) qualifies if you make $125,000 or less as an individual or $250,000 or less as a family.
This also applies to parents who co-signed or took out student loans for their kids. These parent-plus loans account for over 10% of the total outstanding student loan debt.
As of today, a payoff of $10,000, and for some up to $20,000 in student loans will be paid within four to six weeks of completion of the application. You will need to apply BEFORE November 15, 2022, to see your loan forgiven before the new year.
Some may be asked for additional information or proof of income, but that will be the minority.
All payments for remaining outstanding federal student loans will again start up in January 2023.
*****PLEASE NOTE, IF YOU LIKE WHAT YOU HAVE READ TODAY AND HAVE FOUND ANY VALUE IN WHAT I PROVIDE, ALL I ASK IN RETURN IS TO SIGN UP TO RECEIVE FREE UPDATES ON UPCOMING POSTS AND TO FORWARD THIS ON TO ANYONE YOU FEEL IT MAY HELP. THANK YOU*****
https://www.nber.org/system/files/working_papers/w29795/w29795.pdf
https://www.bls.gov/news.release/pdf/cpi.pdf
LEGAL STUFF
This commentary is for informational purposes only. This material is not intended to be, nor should they be construed as financial, legal, tax or investment advice and do not constitute an opinion or recommendation by Enlightened Amadan or its author or the authors employer. You should consult appropriate advisors concerning such matters. This material presents information through the date indicated, is only a guide to the author’s current expectations and is subject to revision by the author, though the author is under no obligation to do so. This material may contain commentary on: broad-based indices; economic, political, or market conditions; particular types of securities; and/or technical analysis concerning the demand and supply for a sector, index or industry based on trading volume and price. The views expressed herein are solely those of the author and not of his current employer. This material should not be construed as a recommendation, or advice or an offer or solicitation with respect to the purchase or sale of any investment. The information in this report is not intended to provide a basis on which you could make an investment decision on any particular security or its issuer.
Certain information has been provided by and/or is based on third party sources and, although such information is believed to be reliable, no representation is made with respect to the accuracy, completeness, or timeliness of such information. This information may be subject to change without notice. Enlightened Amadan and its author shall not be liable to any person in any way whatsoever for any losses, costs, or claims for your reliance on this material. Nothing herein is, or shall be relied on as, a promise or representation as to future performance.
PAST PERFORMANCE IS NOT INDICATIVE OF FUTURE RESULTS.
Any financial instruments mentioned herein are speculative in nature and may involve risk to principal and interest. Any prices or levels shown are either historical or purely indicative. This material does not consider the particular investment objectives or financial circumstances, objectives or needs of any specific investor, and are not intended as recommendations of particular securities, investment products, or other financial products or strategies to particular clients. Securities, investment products, other financial products or strategies discussed herein may not be suitable for all investors. The recipient of this report must make its own independent decisions regarding any securities, investment products or other financial products mentioned herein.
© 2022 Enlightened Amadan