

A Recap of the First Half of 2023
A Recap of the First Half of 2023
What I got wrong, where we currently stand, and how the only truths in the market are Price and Timing....

Cartoons of the Week:


Price is Truth and Timing is Everything
The first half of the year was something special for stocks.
The tech heavy NASDAQ Index recorded its best start to the year in over four decades.

When we look at the broader indexes like the S&P 500, which tracks the top 500 stocks in the United States, it has also had a fantastic start to the year, closing up almost 16%.
Seeing returns like this you would think the backbone of the economy and markets are strong, but when you look under the hood, things do not look so good.
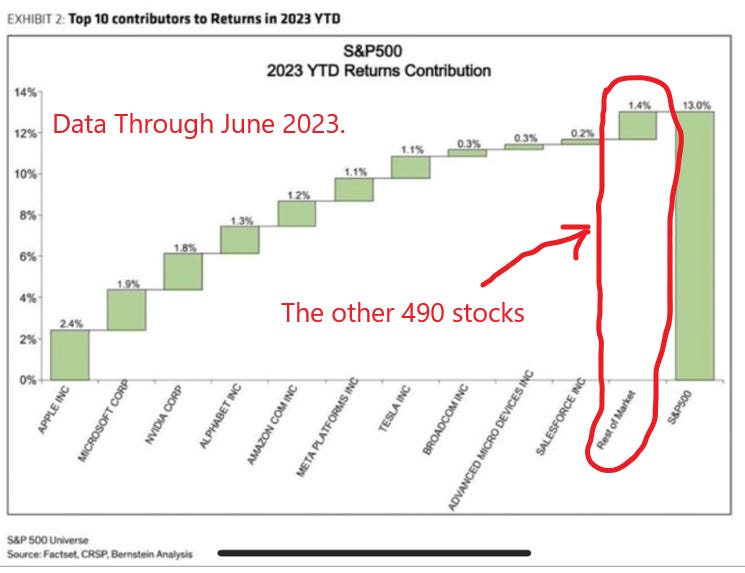
When you break down the returns of the S&P 500, you can see over 65% of its performance has come from only five stocks.

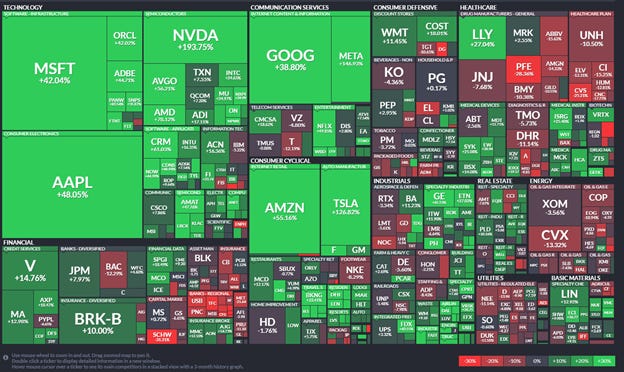
In fact, outside of only a handful of names, the market has been lackluster. Just look at the snapshot below. Some BIG names in the market are DOWN this year so far, with the big Tech name the only ones that are bright green.
When we look below the surface and look at something called breath, which is just the number of stocks out of the 500 that make up the S&P 500 that are beating the index return, it has not been this bad since the peak of the market during the tech bubble of March 2000.

So what gives? Can this trend sustain itself for another 6 months?
Let’s take a look at different sections of the market and economy to see if this strength will continue.
Price is Truth - The Technical Aspect of the Stock Market Today
“Since 1928, when the S&P 500 has advanced between 10%-20% in the first half of a year, the second-half return has averaged 8.6% with a 88% positivity.”
- Craig Johnson, Piper Sandler Market Technician
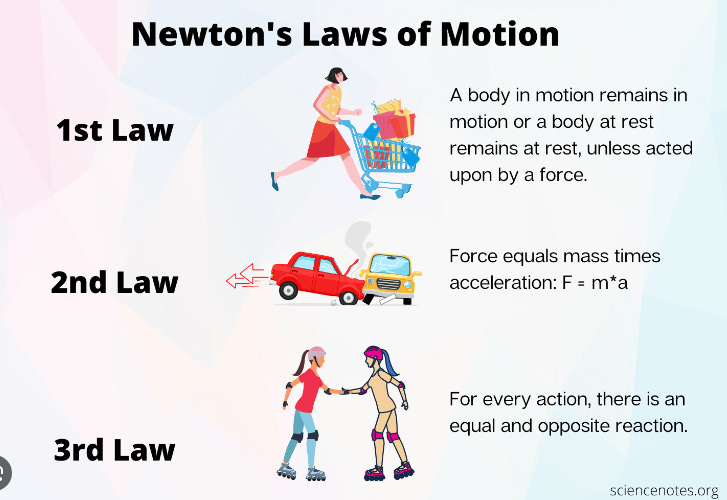
The first rule of market technicians is also Newton’s First Law of Physics written in 1687.

A market in motion will stay in motion unless another force is applied.
There is only one truth in the markets, and that is price.
And right now, the price is moving higher.
And when prices move higher, it usually is a good sign for future price movements to also move higher.
As you can see below, 2023 has the 8th-best first-half performance since 1928.
And when the market has such a good start, 88% of the time it has been higher in the second half of the year with a median return in the second half of 10.41%.
A market in motion stays in motion.

Last month, the market rallied 20% from its lows, placing us in a “New Bull Market”.
This has happened 13 times since 1956. In twelve of those times, the market was higher a year later, with a median return of over 17%.

In fact, when we enter a “New Bull Market”, 80% of the time we go on to make new highs.
As Renmac Macro Team stated:
“We did some work on the historical significance of 20% rallies off market lows as an indication of a “new bull market”. In 16 instances since 1957, 13 of those instances resulted in a new all‐time high (with various degrees of required duration). Only 3 of the instance resulted in a market that then deteriorated and under‐cut the previous low, each of those taking place in the aughts (2000-2010). “
Again, a market in motion tends to stay in motion.
So while we are entering the seasonally weakest part of the year….

…technically, the stock market is giving us the all-clear.
Fundamentals EVENTUALLY Drive the Market - BUT Timing is Everything
If the market technicals’ s are giving us the all-clear and follow the first law of physics, then we need to find out what MIGHT be the net force that will push this market lower.
The market is driven by endless amounts of data but it all comes down to two inputs.
Earnings and earnings growth
How much do you want to pay for those earnings (IE: Multiple)
When we look at earnings, we have not seen much to get excited about.

As the picture above highlights, earnings were flat to down in the first half of the year.
So what pushed the market higher?
The multiple people are paying for earnings.
As you can see below, the multiple for a dollar of earnings has increased from 15.2X during the lows in September to 19.28X today.

Last September, if a company was earning $1 per share, you would have to pay $15.20 for a share of that stock, on average.
If that same company is still earning $1 today, you would have to pay $19.28 for that same share of stock.
That is an 8.50% increase in the stock price despite seeing earnings growth flat to down.
Below is a great chart showing this relationship over time. The green is earnings growth and the blue is multiple growth. So far in 2023, ALL of our gains have come from multiple expansion.

And while the price you pay for a dollar of earnings (IE multiple) is not predictive of what the market may do in the future, at least in the short term, over the long term, it weighs on the market like an anchor.

Economic Indicators Lead Earnings Growth - So what do the Economic Indicators Tell us?
If a market technician follows Newton’s First Law, then a Market Monetary Strategist follows Newton’s Second Law - They try to forecast the coming forces in the market that will impact earnings growth, multiple growth, and ultimately the direction of the market.
To do this, they use economic indicators we now call “leading indicators”. Leading indicators historically turn slightly ahead of the markets.

When we look at leading indicators today, they are painting an ugly picture of what may lie ahead.
The best monetary strategist on Wall Street today, Francois Trahan, said it best in a recent report:
“It is difficult to be a monetarist in 2023 and not see the current backdrop as a slow-moving train wreck. While we always try to keep an open mind about our thesis and where it might be wrong, none of the bullish arguments currently circulating on the Street are compelling in our opinion.”
He followed these comments up with the rational reason why he feels this way:
“Let’s recap: the yield curve is inverted, money supply growth sits at its most negative rate in over half a century, we’ve had the most aggressive pace of monetary tightening since Paul Volcker’s first cycle, and the Fed is shrinking its balance sheet (QT!). Also, bank lending standards have already tightened significantly. What do these economic series have in common? They are all anticipatory indicators (AEIs) of the business cycle that are associated with upcoming economic downturns. I am not trying to be extremely dreary. I’m merely making the point that a soft landing in the economy, in this context, is a remote possibility that requires a lot of “it’s different this time” thinking.”
When you are a society run by credit, what rate you pay on that credit eventually matters.
In one of his charts, he uses the 30-year yield, advanced 18 months, to give you an idea of the type of market we may be heading into.

As you can see below, one of the leading indicators many use is the ISM Survey New Orders Index. Over time, this has had a great real-time predictive impact on the stock market.

And per the SLIM survey by the firm Strategas Group, ISM New Orders are set to decline again as we head into this fall.

Other economic indicators that historically have predicted future market movements are nearly all moving lower over the past month.

This is on top of the already record-breaking yield curve inversion we have been seeing for over a year now.

As Thomas Tzitzouris at Strategas Research recently said in a note:
“The 2s/10s spread is in the 0.01 percentile!! Specifically, over the last 40 years, and over 9,974 closing day observations, there have been only 2 days where the 2s/10s spread closed lower than it closed yesterday, and both of those days happened this March.”
Not only has the yield curve inversion been a perfect leading indicator of a coming recession, but the longer the curve stays inverted, historically the longer the ensuing recession will be.
And when we put all these “leading indicators” into a model to predict a recession, we get back the following.

Unless it really is “different this time”, we have nearly a 100% chance of seeing a recession and economic downturn in the next 12 months.
Four Things to Watch in the Second Half of 2023
1. The US Consumer Spending Habits
We have all been feeling inflation pain for the last 18 months.
While we are all employed, it has still been very difficult to keep up with the bills.
Many of us were fortunate enough to have excess savings during the COVID lockdown due to government stimulus checks, government small business loans that never had to be paid back, or just not doing anything when locked in our houses all day.
It has been these excess savings, combined with supply chain issues, that started the inflation mess in the first place.
Now this excess savings is quickly vanishing.

At the same time credit card balances are exploding higher.

We are starting to see defaults and delinquencies move higher on credit balances, led by those under 30 years of age.

We are seeing bankruptcy filing skyrocketing higher

Right at the time student loan debt will start to be repaid.

With a potential $60 billion needed to start to pay down student loan debt, it’s hard to get excited about the U.S. consumer spending in the second half of the year. (as a reminder, there is no getting out of student loan debt. It stays with you even if you file for bankruptcy. It is a very very heavy chain around the neck for those who owe money for their student loans).
Since your consuming habits make up 70% plus of our growth as a country, so goes the US consumer spending, and so goes our economy.
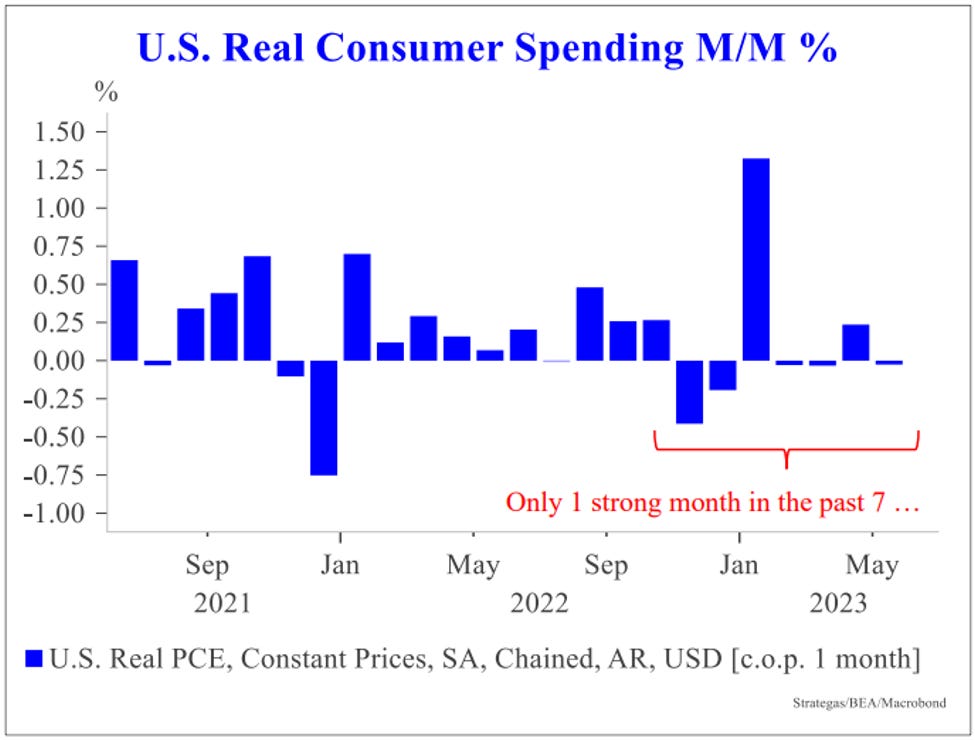
As we enter the second half of the year, keep an eye on consumer spending. It has been weak but can get much worse if the consumer finally cracks.
2. Unemployment Trends
Labor costs have skyrocketed for businesses.

We are constantly seeing companies give in to labor with higher salaries to keep pace with inflation.

This usually does not end well.
As the Economics team at Piper Sandler recently stated about labor costs and inflation:

Below is a perfect example of how inflation and labor have impacted a company.
Let’s look at General Mills, one of the biggest food producers in the world.
Their top-line sales were up 6% Quater over Quarter, which is very healthy.
But with a 25% increase in product and labor costs, they are still losing about 15% or more on a real dollar basis (after inflation).

It’s like running up an escalator the wrong way.
It eventually catches up to you.
And while General Mills is having a healthy top-line growth number of +6% Quarter over Quarter, their sales growth has been up an amazing 13% year over year!!!
Investors have been super excited about these types of sales growth numbers we are seeing from many companies. This may be the reason why the stock market has been doing so well.
But when you look under the hood, it’s coming from one area only. Price Increases!!!
Look at the latest 10-Q release from General Mills below. Sales volume was flat. All their growth has come from price realization (IE Price Increases).

The only way for them to grow is to charge you WAY more for your Cheerios.
And since General Mills is one of only 11 companies that control our entire world food market, they are getting away with it. At least for now.

But with a consumer that is close to being tapped out, with bankruptcies skyrocketing higher right before student loan payments kick in, how many more 16% price increases do you think they will be able to push through before sales slow?
Right now these companies are running in place, and that is with the ability to push prices higher. What happens when growth slows and they are forced to cut prices?
They will look to cut costs immediately. And what is the easiest cost to cut? You guessed it. Employees.
You will see the weakness first in initial jobless claims. This has already been rising steadily since the beginning of the year.


As claims go, so goes the stock market.

This is the one area that will determine a future recession. You may alter your spending slightly because of inflation pressures but real spending changes do not happen until you lose your job or source of income.
That starts a vicious cycle of cost cuts, then spending habit changes, then more cost cuts. This cycle usually starts when we are well into a recession.
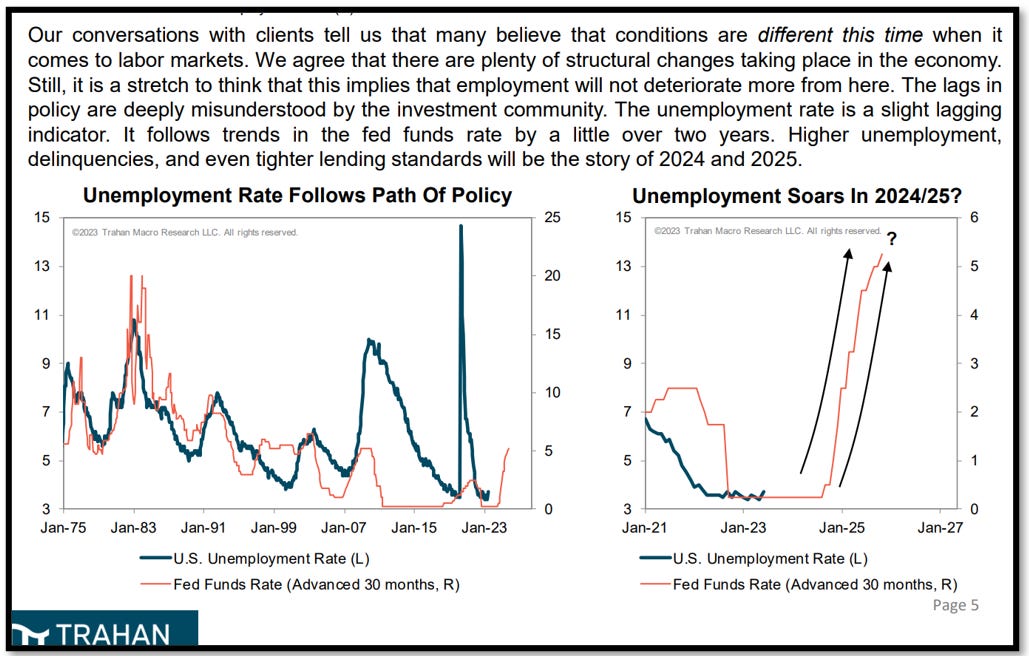
So while employment trends have been the best we have seen in multiple generations, look where “duration of unemployment” falls under our economic indicator list.
It is a lagging indicator. So if we start to finally see the cracks in employment, we will be well on our way into an economic downturn already.
Right now, this is the thing keeping us afloat. Let’s hope it stays that way. No cracks here mean no recession.
3. Credit and Lending Standards
Bank deposits are plummeting.

We have seen it with our clients already. Why keep money in a bank earning 1% or less when you can move it to a money market and get 5%?
After the banking issues in March, consumers have changed their banking ways. Use banks for transactions only and move everything else out of it.
And since bank loans are based on the amount of deposits, credit standards will tighten up significantly.
We have just seen the largest reduction in deposits since 1984.

Which is already pressuring credit tightening at banks.

We expect this trend to continue in the second half of 2023. This trend is not looking good. And since credit is the lifeblood of our economy, we will really need to see a change in credit issuance and standards to sustain the current economic excitement.
4. The Perplexing Stock Market
The market has done a lot of work to get back on track. As we stated at the beginning, it has climbed a wall of worry and is now technically very strong. As Newton’s first law states, an object that is in motion tends to stay in motion.
As Newtons Second Law states, we will need to see a great force to be able to stop this strength.
Historically that force has come from one of three things:
Consumer Spending Drying Up
A rapid rise in unemployment
A credit crisis or credit drying up
In the next 18 months, the probability of one of these three taking us into a recession is extremely high. But if they just slow, it will not be enough to stop the momentum we have seen.
So now that we have outlined the basics, let me outline for you what i find really perplexing at the moment.
I find it hard to see the market staying at these levels, or moving higher, without one or both of the below happening:
A pickup in growth and/or
Rates moving lower
If we get a pickup in growth, inflation will stay elevated, forcing the Fed to continue to raise rates. If rates go higher, then the stock market on a relative basis will become stupidly expensive.
As you can see below, today stocks, bonds, and treasuries are all offering the same yield. What happens if rates move even higher? Stocks will offer the worst yield of the three but have the highest risk of the three.

What does this mean?
Right now you are not getting compensated AT ALL for taking equity risk in the stock market.
Below is another way to look at it.
This is a chart of the equity risk premium, the premium that has ALWAYS existed on the earnings yield of stocks over that of bonds. Since stocks are much more risky than cash or bonds, you need to get paid extra for that risk.
Well today, we are at or near all-time lows on the S&P 500!!!

On the NASDAQ it is even worse.
The chart below takes the current real interest rate in the market (bond yields - inflation) and plots it against the MULTIPLE in the market.
Throughout history, the higher the real yield on bonds, the lower the stock market multiple.
The red dot below is where we are today. The few blue dots above it are from recent months.

So this tells me one thing and one thing only.
To justify the multiple today, the stock market is fully pricing in a massive rate cut in the next year or two.
So, what will make the Fed reverse and start cutting rates?
A recession.
And in a recession people will lose their jobs, spending stops, and companies cut costs as fast as possible.
Also in a recession, earnings decline by 20-50% on average with multiples decline in a similar fashion.
So while the market has had a great first half of the year, and we have missed some of that rise being risk-off, unless “this time is really different” it’s hard to see this party lasting much longer.
But, as I mentioned above, Price is Truth and Timing is Everything. Will the economic forces I outlined above be enough to stop the current motion and momentum of the stock market from moving higher?
We think it is.
As a result, we continue to underweight stocks and favor high-yield bonds and cash as we progress through the rest of the year. While our timing has been off, and the price has proven us wrong, we still feel really good about cash and other items that carry very little near-term risk relative to the stock market.
One Last Thing
I wanted to leave you with some comments from Stanley Druckenmiller, the CEO of Duquesne Family Office.
In this interview with Bloomberg, he says the following:
“A lot of people have changed their forecast because it has not happened yet. The fact it has not happened yet does not change the probability if it happening, or the depth of it what it would look like. (he is talking about a recession)
Just because it has been pushed out versus expectations does not mean the probability of it happening is any less. In fact, the longer inflation stays in the system, the sticker it gets, increasing the probability of a hard landing not a soft landing.”
Below is a link to the full interview.
If you just want to hear his comments about the economy and markets, fast forward to minute 9 and listen through minute 16.
I think it would be well worth your time.
Thank you. Have a wonderful weekend!!!
PS: Starting next week, for 4 weeks, I will be writing a multi-part series on Globalization.
As always, comments and questions are welcome.